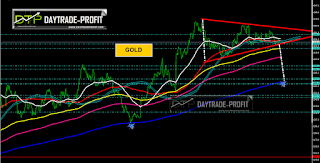
Gold Daily Technical analysis
Daily Technical analysis update :
Get ready for move ……
if gold will break 1330 area you should expect to see 1268 area +_
there is A symmetrical triangle – chart formation where the slope of the price’s highs and the slope of the price’s lows converge together to a point where it looks like a triangle.
What’s happening during this formation is that the market is making lower highs and higher lows. This means that neither the buyers nor the sellers are pushing the price far enough to make a clear trend.
 |
| GOLD |
Basically As long as gold xau/usd stay and trade below 1352+_ the trend became bearish, I’m expecting to meet 1333 1326 1315 areas – break down 1315 level will lead the gold to 1294-1304 point, then it could go to 1247-1256, while we need to watch at 1268-1274 area.
while break above we lead above 1400$ price area .
Strong support: 1224-1233 price areas are meaningful numbers
This review does not including any document and / or file attached to it as an advice or recommendation to buy / sell securities and / or other advice

