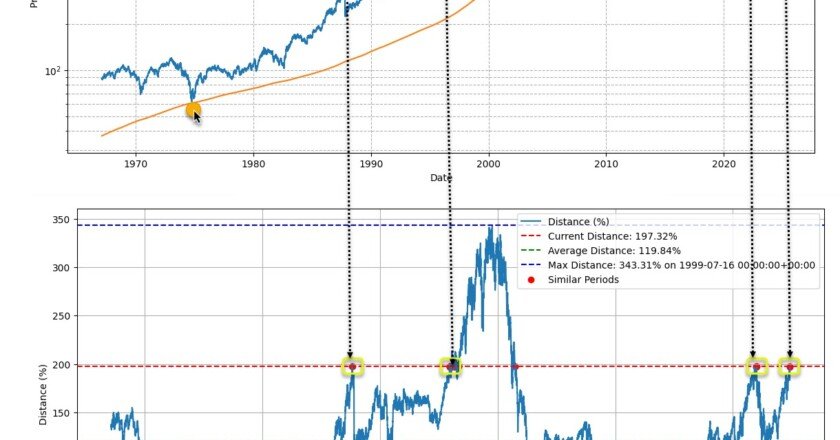
As the markets continue to rally and investors keep an eye on the broader economic conditions, many of us can’t help but wonder: is history repeating itself? A recent analysis of the S&P 500 (SPX) compared to the tactical moving average reveals some intriguing parallels to the events that unfolded before the infamous dot-com bubble of the late 1990s. Understanding…