MARKETS TECHNICAL ANALYSIS
The demon came out of the bottle and Financial markets bleeding
It’s still too early to know the extent of the virus’s impact on the markets
It will not be a correction as it was in previous times
Since this has real economic effects, let’s face it
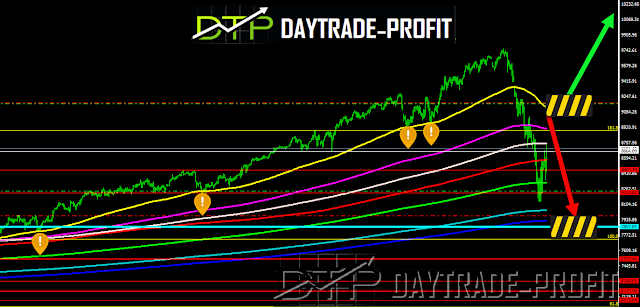
But on the other hand, to say that we are going to the bear market it is still early because as I mentioned earlier this year and in previous posts, the main and important levels of support are down – only if you cut them down then the market will fall and the trend will be declining
in 2018, the markets tested this line. Will it happen this time too?
In my opinion, there are 2 possible scenarios to follow
The first correction goes up to test levels that have been broken inability to pass them and back to declines to examine the rising trend line unless they pass them up and then we can say that the danger has passed
The second is a continuing downward trend for the rising trend line
 |
| markets analysis |
risk: reward is starting to favor bulls? Or we will get pardoned and come back down to check the critical levels that are on the upward trend from 2009
In 26.2.2020 there was big inside day correction – look on the bands from 26,700 points to 27,500 points – not managed to cross above the azure band – if next day it will manage to cross this band you should expect to meet red bands critical -because since the trend changed the index didn’t successes to cross this band
yesterday also we see huge recover in the index but the danger didn’t pass
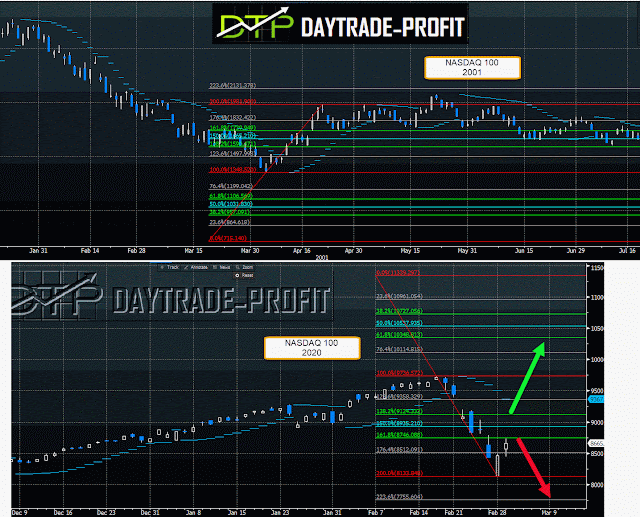
For the Nasdaq 8700-9100 is the critical level – only cross up those levels will confirm the trend changed –
Inability to cross those levels in my opinion will bring the market back to lower levels
For example, we will need area 7800 and we will review the image again
In 2001 there was a similar look – I want you to look at it – it reminds us of what we are currently experiencing in the markets
 |
| Nasdaq analysis |
Look at the year 2001 = April and make the receipt in reverse graph
 |
| stock market news |
This review does not include any document and/or file attached to it as an advice or recommendation to buy/sell securities and/or other advice

