Markets Technical Analysis
Last week we saw the markets performed strong moves – the price was driven by a combination of slowing economic data and geopolitical risks – expect high volatility until the uncertainty of a trade deal between the United States and China will end
This month we expect for meeting between us and china and also see what will happen with the UK ( BREXIT date need to be till the end of October) and of course, the formal start of Q3 earnings In the US -this week is last week before earnings season
The futures market indicates 76% chances of a rate cut later this month – in 30th October FOMC Statement US Federal Funds Rate & Press Conference
 |
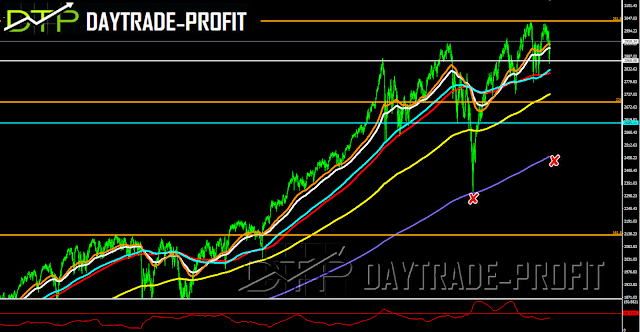
| SP 500 |
Slowing world trade
Global economic growth is experiencing a slowdown. This economic weakness is more pronounced outside the United States than in the United States, but even there has already begun to seep – the world is round
The Bears are quick to jump on this weakness as a reason why the U.S. stock market will fall. How many times have you heard those words in the last 10 years?
1. Emerging market / China weakness will lead to US stock market crash!
2. European problems will lead to infection in the US!
3. The bubble of developed countries will lead to economic recession and the US bear market
In dominoes when one stone falls then the other too
Something on a personal note
In my opinion, we are ahead of an explosion – a crisis in Turkey seems inevitable
Trade agreement not yet signed – Expected expectations and actions nothing if the markets compete for agreement and it will not happen ….. or vice versa bought rumored to know
Barca sit – Laughter Laughter But it’s just a bad joke – Not successful, and not knowing what they want of themselves, these British, and it drives Europe crazy – The question how to get out of this mess
U.S. housing weakness and bond yields
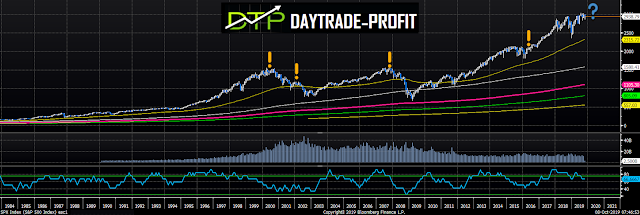
The question is, not whether we are downhill but when – I am not ruling out new highs but …. It will not be a real rally but a fool’s rally in my opinion
Under the surface and it’s no secret – everyone knows unintelligible things are happening
There are many tensions and asymmetries in the behavior of the markets
I’m pretty sure it won’t end in the best hope of being lost
My models and properties also show contradictions and this is very confusing
There are the gold and Bitcoin oil stocks and of course, the Forex – all of these can be seen as not easy to digest and this will end up in the stock market as well – never resilient
In 2008, when the Fed launched an emergency strategy to bail out the financial markets with WE, the Fed’s balance sheet was about $ 915 Billion, the rate was at 4.2%.
Now if the market falls into a recession tomorrow, the Fed would start with roughly a $ 4 Trillion balance sheet with interest rates 2% lower than they were in 2009.
The Fed’s ability to “bailout” the markets today is much more limited than it was in 2008.
The upswing in the markets mainly since 2018 based on “hopes” – they have held the story of highs in the market despite weakening earnings growth and estimates
Look on the future E mini 500 (Sp 500)
If it is only a halt then we should see the Sp 500 crossing up again 2967-2973 points, otherwise, the case could become uglier……
 |
| E mini 500 |
 |
| Sp 500 position |
This review does not include any document and / or file attached to it as advice or recommendation to buy/sell securities and/or other advice


