USD/JPY Price Technical Analysis Forecast
If we go back and look at the trend and behavior of the USD / JPY pair we can see some interesting things
You do not have to go too far, you can look at the pair’s analysis in 2016 – before Trump’s election I wrote a review of the pair, the goals were achieved, but that is not the essential issue
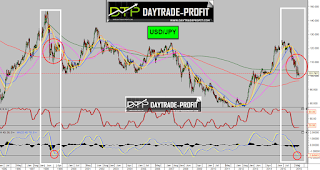
What is essential is the future expectation of the move, by looking back at the years 98-99 that still show me the same pattern
“Once again I turn your’s attention to 1998-1999
Note the charts: If the photo is indeed the same, then it is fitting for
Continued increases in the usdjpy, move into a similar facility.”
 |
| usd jpy forecast |
And indeed he reached the targets of Area 118 within a short time
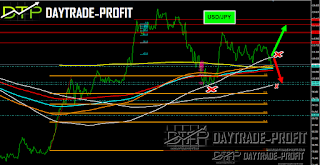
Right now from what I see and conclude from the graph by a number of factors the pair is on its way down to areas of 93-96
With an option to drop even lower levels to areas of 86-88
You can see clearly that even though the stock market breaks records, the pair can not rise and even reach the high that we saw in the selection of Trump, on the contrary, the pair shows a great weakness, both technically and clear prices
now you can search easily extactly what you looking for
There are several factors that show me this , I will focus on 3 essential factors
The first is the basic analysis of the pair from 2016 – the first goal was achieved and now this is my opinion the second stage
The same behavior can be seen in the years 1998-1999
If we look purely technical we see clearly that the pair broke the 109.30 level which formed a long axis and support level for many years
Therefore as long as the USD / JPY is below this level the trend is negative
 |
| usd jpy analysis |
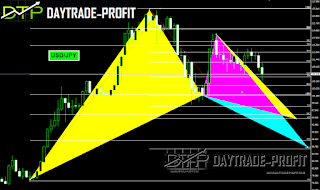
Second is at the harmonic level of the price level graph, the technical patterns that the pair shows here show that two options or two scenarios
First: Bullish Gartley pattern
The second is: Bullish Bat patterns
 |
| usd jpy pattern |
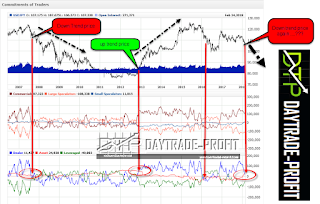
And the third and last but not least is the position report
The report clearly shows how the trend is reversed in the face of the positions.
Pay attention to 3 past cases that show the same behavior.
I will deliberately focus on two of them because the third in 2016 you will see up in the post.
Years 2007-2008: usd jpy decline from the level of level 111 to 78 in 2011
I marked the process of changing the positions in a red circle.
The years 2013-2015 can be clearly seen in the position change given a break above what took the usd jpy pair to an impressive move up until the middle of the end of 2015
Why do I show you all this – because once again if you pay good attention you can see the buds that this move and change positions takes place before our eyes, will this time also work and usd jpy will give the target: I think yes
 |
| usd jpy position |
This review does not including any document and / or file attached to it as an advice or recommendation to buy / sell securities and / or other advice

