Gold brought the opposite surprise – what’s in the plan next?
A strong breakdown of gold price at the opening of trading earlier this week
I previously wrote multiple times that the gold market seems to really want to decline, and what happened over the last few trading days shows you that the market agreed with me.
Gold price analysis
Everyone is talking about new gold records expected to see new numbers, Maybe that’s not the direction at all ……..

“According to the news agency Bloomberg, more than 3,000 futures contracts worth over $500 million were traded within the space of one minute – too much for the market, which is usually characterized by a low level of liquidity for that time of the day,”
Gold Flash Crash: sudden burst of selling in the gold futures contract sent Gold prices plunging to as low as $1,676.0 or almost $100 lower from the Friday close of $1,761.
Now in your possession before the technical analysis, let’s take a look at the position map in the market’s, resemblance to the years I talked about can also be seen here


You can see that someone was preparing for this movement:
Note the changes in positions on 06.8.2021 for the first column
It is unusual to see the reduction in the amount of position in the long by a ratio of 1: 2 over the short, when with the other members it is far from being so – the relationship between the short and the long, plus the picture of their positions was different …..

Now let’s go to business – Technical analysis on the gold price
Bullish Scenariomove over $1776 will indicate the presence of buyers, this will indicate that gold moves get the potential trigger point for an acceleration into 1823$ 1880$ 1960$ levels while the major point stands on 1830$+_
Bearish Scenariomove under $1670 could create the downside momentum needed to challenge $1703, followed closely by $1620 could trigger an acceleration to the downside with the next target the main bottom at $1530 and even more to 1400$
The important levels for looking at and examining the property are in a number of areas in my opinion, they should be followed 1400 1530 1580 1620 1677 1703 1726 1776 1794 1823 1880 1960

Today inflation numbers in the U.S – US Consumer Price Index (CPI), Further signs of rising inflationary pressures could instill dollar bulls with a renewed sense of confidence as expectations intensify over the Federal Reserve shifting its policy outlook. On the flip side, if inflation cools, this may reduce some pressure on the Fed to act, potentially sending the dollar lower.
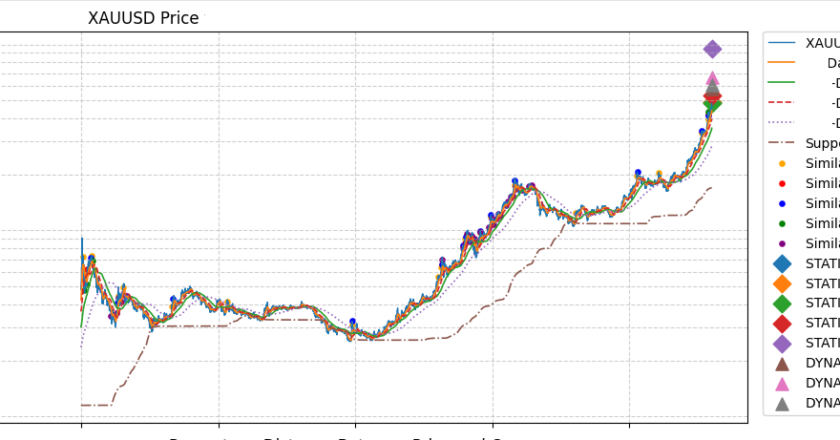
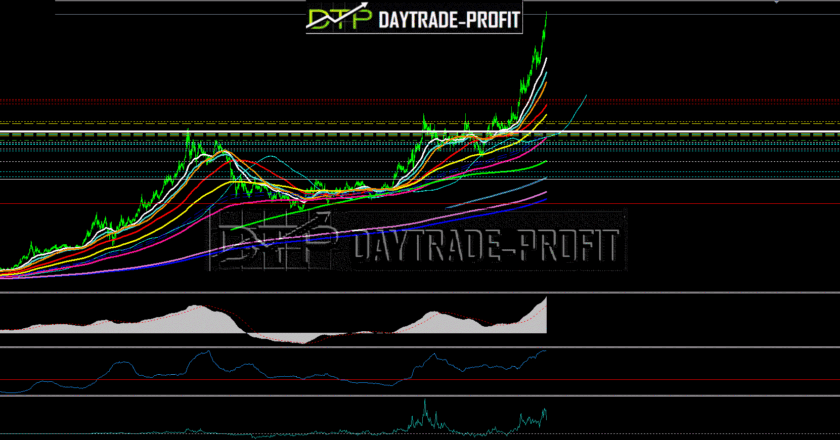
The next few days may lead to back and forth action instead of continuing to decline, but this is unlikely to happen over time. Based on the self-gold pattern in gold (the resemblance is mainly to the period 2011-2013), gold may fall to the previous low of 2021 relatively soon, even if it does not happen immediately.
Want to trade on gold – The best trading condition
13 pips spread only on XAU/USD
This review does not include any document and/or file attached to it as advice or recommendation to buy/sell securities and/or other advice


