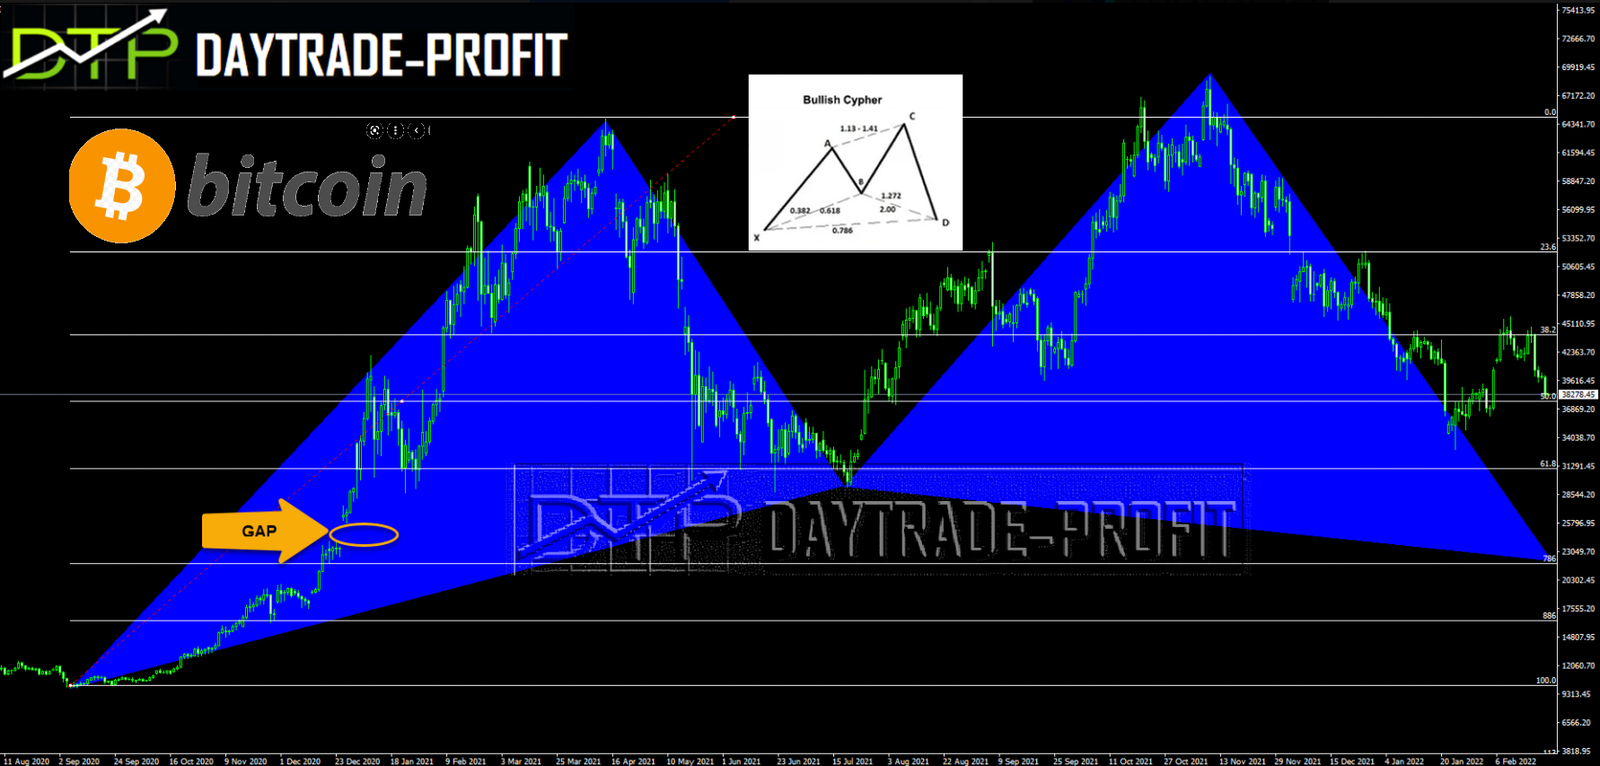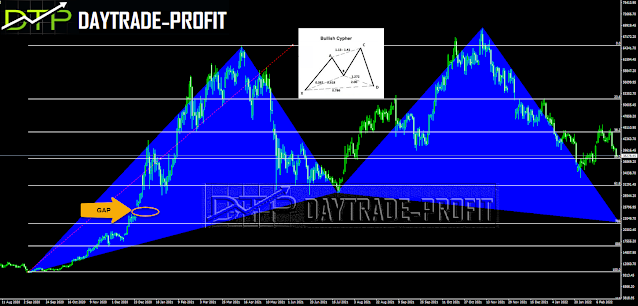
Bitcoin price analysis
It’s been a long time since I published a post on Bitcoin
wonder if Bitcoin is on its way to closing old gaps?
There is a trading pattern that caught my eye: Cypher Pattern
The Cypher pattern is a reversal formation within the harmonic class of patterns. It occurs across various financial markets including forex, futures, stocks, and crypto. Having said that, it is a less commonly seen structure compared to some other harmonic patterns such as the Gartley, Bat, and Butterfly patterns.
Cypher pattern consists of four separate price legs, with certain clearly defined Fibonacci relationships. We will be discussing each of the important Fibonacci ratios within specific rules and conditions that must be met for it to be specified.
We can see that the pattern is a five-point structure, denoted as XABCD. As such, there are a total of four individual legs that make up the pattern. The first leg is the XA leg, the second leg is the AB leg, the third leg is the BC leg, and the final leg is the CD leg. Can you see how the A point and the C point within the bullish cypher structure are making higher highs, and similarly, how the B point is making a higher low

Bullish Cypher
The AB leg must retrace the XA leg by at least 38.2%, and it should not exceed 61.8%.
The C point within the structure should be a minimum 113% projection of the XA leg, measured from point B. At the same time, the C point should not extend beyond the 141.4% level.
Point D should terminate at or near the 78.6% Fibonacci retracement level of the price move as measured from the start at point X to point C
.Technical analysis Resistance level- 41000, 45000
Support level- 33000, 28000 , 24000 , 21000 ,
Open gap at 24000 $ price area

This review does not include any document and/or file attached to it as advice or recommendation to buy/sell securities and/or other advice

