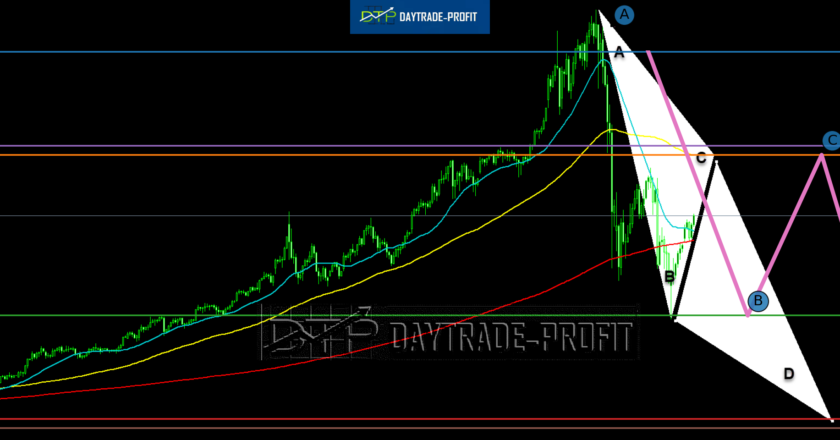
Bearish Bat Harmonic on the Chart: A Reversal Setup Worth WatchingOn the current chart, XAG/USD price action is sketching a Bearish Bat: an elegant “M” that often precedes a disciplined pullback once buyers exhaust themselves in the Potential Reversal Zone (PRZ).Snapshot Pattern type: Bearish Bat (harmonic) Primary PRZ: 50.63–51.415, with AB=CD ≈ 50.905 reinforcing the zone Deeper Bat completion (0.886…
Silver Market Overview – October 28, 2025 Current Price: $45.80 📉 Change: -0.90 (-1.91%) Institutional Positioning (COT) CFTC Disaggregated COT Report – Silver (as of Sept 23, 2025) Group Long Short Weekly Net Change Sentiment Managed Money 51,225 14,126 ▼ -1,327 longs ✅ Still Bullish Swap Dealers 25,785 69,717 ▼ Net Short 🔻 Hedging Other Reportables 21,093 5,916 ▲ +729…
🟡 GOLD Overextension Alert: A Rare Price Dislocation from the Mean 📅 Date: October 15, 2025 📌 Key Insight: Gold Is Trading at Extreme Distance from Long-Term Averages The chart below tracks the percentage distance between Gold (GC=F) and its key moving averages. The current reading is flashing a historical red flag: Gold is now trading 35.65% above its long-term…
Gold (XAU/USD) has seen aggressive bullish momentum recently, marked by a sharp, nearly parabolic spike. Current price action, combined with investor sentiment, strongly indicates short-term exhaustion, posing considerable reversal risks. Fundamental Perspective The recent bullish surge was primarily driven by geopolitical uncertainty and speculative buying rather than robust fundamental demand. Today’s tariff announcement by former President Trump could exemplify the…
The crude oil market continues to attract attention from traders and investors alike, as global uncertainties and evolving supply-demand dynamics drive price movements. In our latest analysis, we’ve identified potential target prices at $67.90 and a more conservative estimate around $64.50, noting that resistance remains firmly positioned near $73.40. Understanding the Targets $67.90 Target: This price point represents a critical…
The SP500 index appears to be entering a critical phase. Current projections indicate a potential decline to the 5500-5600 range, reflecting a natural market correction or consolidation. However, this move should not be viewed purely as a bearish signal. Instead, it may act as a setup for a significant upward wave, akin to the explosive rally seen during the mid-1990s…
As the markets continue to rally and investors keep an eye on the broader economic conditions, many of us can’t help but wonder: is history repeating itself? A recent analysis of the S&P 500 (SPX) compared to the tactical moving average reveals some intriguing parallels to the events that unfolded before the infamous dot-com bubble of the late 1990s. Understanding…
The S&P 500 in an Apocalyptic Scenario: Interpreting Harmonic Patterns Amid Global Turmoil In today’s world, the S&P 500 is being run to a new high despite unprecedented geopolitical tensions, military conflicts, and economic uncertainty. From Middle East turmoil and U.S. election drama to the Russia-Ukraine war and China-Taiwan tensions, Even in such as un understanding times, harmonic patterns like…
Markets analysis long time I didn’t update about the markets ,It’s time to check what’s going on here in 2021 i post S&P 500 prediction for the next years Has the Market Correction Started? The question of whether a market correction has started is always a topic of interest among investors. However, it’s not always easy to answer. Market corrections are typically…
Markets Overview and Risk Assets The last post was: Are we seeing the high for the short-medium period? Also in May, I wrote: Does the economic situation of the stock market combined with the bond markets reflect the real problem The question is whether what we saw from the bottom in 2020 is just the trailer for the future to come…

