Markets Technical Analysis Update due The emergence of a bubble in the financial markets
Well are we witness on the bubble again, The markets recovery is nearly 100 months old and exceedingly long-in-the-tooth by historic and nothing Semmes to bother: market volatility is at a 24-year low. That’s despite the unprecedented convergence of political, fiscal and monetary policy risks to say nothing of foreign policy hot spots from Ukraine to Syria and the Korean peninsula
The current environment more closely resembles that of 1999 as the market heads toward the end of a bullish phase with valuations extended, exuberance high and fear extremely low
2017 Recession Or Records In The Markets I talked a lot about the market’s behavior and predication since 2016 mainly, and Predicted the last jump since Trump’s election
This week we have some Data from US :
Fed speakers
towards the end of the week Federal Reserve officials are in action. Cleveland Fed boss Loretta Mester speaks in Minneapolis on Thursday, while St Louis Fed president James Bullard talks on ‘US Economy and Monetary Policy’ on Friday. With the FOMC widely expected to raise rates at its June meeting markets will be sensitive to what they have to say about how they think policy is going in the short term.
Earnings season
the end is in sight for the first quarter earnings season but we still have a number of large cap stocks on both sides of the Atlantic to report. Retailers Target, Home Depot and Gap provide the interest from Wall Street this week.
I chose this time to focus on the Nasdaq index
The index breaks records and there seems to be nothing stopping it from going up
If this is indeed the case, and we are at the beginning of a bubble move, we have quite a hurdle to go through
Nevertheless, we have forgotten that the index has not stopped rising for nine consecutive years since the last crisis
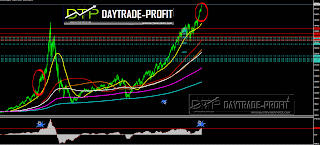
We can see in the graph the emergence of a bubble market
There is an oscillator who Shows the entry into a bubble territory – is not yet there – very close to do so (mark on the charts )
 |
| Nasdaq forecast |
My opinion is that even if we are in the midst of an upsurge, we have a number of things to attribute to them importance: This is the month of May, and historically this month there are realizations (usually stresses)
Another thing, the elections that took place in France, the markets stormed up, leaving Gap (price gap between closing and opening)
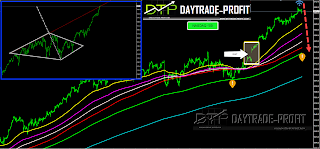
In my opinion, between the 16th and 24th of the month there will be some realization of about 300 + _ points
If my theory proves to be justified, it is quite possible that the NASDAQ will continue to areas of 5720-5810 points and from there we will experience the correction
What’s more, technically, you can see the diamond pattern
If this is the case, then its goals are in the areas I enumerated
 |
| Nasdaq analysis |
This review does not including any document and / or file attached to it as an advice or recommendation to buy / sell securities and / or other advice
www.daytrade-profit.com


7 Comments
william oscar
The superb highly informative blog I’m about to share this with all my contacts.
Accounting Firms in Toronto
Mr Khan
Don't delay your financial planning. People who save or invest small amounts of money early, and often, tend to do better than those who wait until later in life.online payday loans indiana
DAYTRADEPROFIT
Thank you very much for your kind words 🙂
Saqib Khatri
Thank you so much as you have been willing to share information with us. We will forever admire all you have done here because you have made my work as easy as ABC. financial news for today
Arslan Saleem
Thank you I am glad about the encouragement! I love your site, you post outstanding. Jubilee Car Insurance – travel insurance for schengen visa
Excel Tmp
Thanks for sharing this useful article. I have learnt a lot of things. Printable Gap Analysis Template Excel
Mehak Khan
I haven’t any word to appreciate this post…..Really i am impressed from this post….the person who create this post it was a great human..thanks for shared this with us. w88 com