GBP USD TECHNICAL ANALYSIS
GBP/USD accelerated to as high as 1.3514 last week after election-The pound has pushed the rise to record its best level since May 2018 following the result, But important questions remain unanswered – UK-Europe trade talks route remains a major unknown factor for now
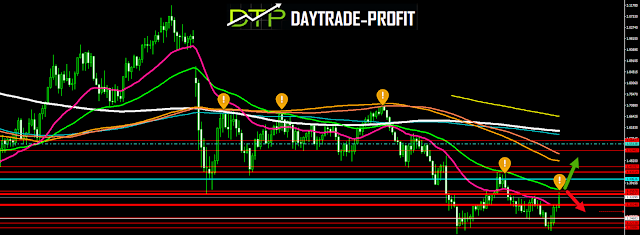
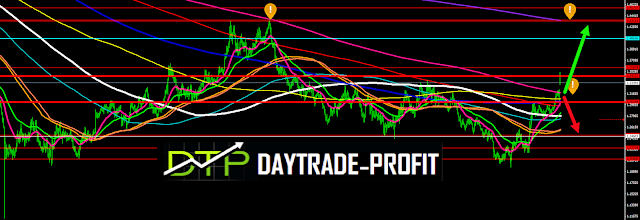
Possible Correction to the Downside should be contained above 1.3160 support to bring another rally.
On the upside, move above 1.3660 will target higher numbers such as 1.43-1.48.
near outlook will stay bullish as long as 1.2780-1.2920 support holds.
In the longer-term picture, Focus would then be turned to 1.43-1.48 key resistance for confirmation.
GBP USD Technical analysis
The long-term chart is showing to us that As long as GBP USD will stay below 1.3650+_ Key support the trend is down -a break of 1.2840 support will indicate short-term topping. If it will fail to stay above the level, it will be turned back to the downside for 1.2770 support.
Short-term chart as a long as GBP USD will trade above 1.3160 – next resistance will stay on 1.43-1.48+_, those are the areas for topping correction after the long decline —However a daily break of 1.3660 would bring stronger rebound -I still believe that the pound will not succeed this time breaching 1.3660 level _ and the probability of further declines is higher than the breach of resistance- but only time will tell if I’m right or wrong
This review does not include any document and/or file attached to it as advice or recommendation to buy/sell securities and/or other advice


