crude oıl analysis, the prediction came true in 100%
this post is written by me for FXEMPIRE in 18.1.2016 – as you can see in your eyes 100% accurate
With the lifting of sanctions, Iran would be able to export as much crude oil to the world as it can, or as much as it can find demand for. Before imposing an oil embargo on Iran in 2012, one in every five barrels of Iranian crude went to European refineries. Iran has been selling just over one million barrels a day for the past few years, mostly to China, India, Japan and South Korea.
Iran says it will hike sales by 500,000 barrels the day after sanctions are lifted and increase total exports to around 2.5 million barrels within the next year. This will push the price only to one direction: downwards. The market is already flooded with cheap oil and there will be many more barrels in the market than there are buyers.
In order to win back its customers, Iran plans to offer discounts on prices that are already the lowest in 11 years. Iran’s full return to the market could trigger a price war with its arch-rival Saudi Arabia, which is trying to keep its own market share by selling under the market price.
Rather than causing an economic crisis, the worst of the oil price slump may already be over. The depressant effects of falling commodity prices hit hard and fast. Their positive impact almost always takes longer to trickle through the economy. We may now be seeing that inflection point in the West.

USD/CAD and Crude Oil- How Would They Be Affected by the Latest Events in Iran?
According to eia: “suggesting that the market expects WTI prices to range from $25/b to $56/b (at the 95% confidence interval).”


Now let’s have a look at the oil industry:
The Baker Hughes Rig Counts are an important business barometer for the drilling industry and its suppliers. When drilling rigs are active they consume products and services produced by the oil service industry. The active rig count acts as a leading indicator of demand for products used in drilling, completing, producing and processing hydrocarbons.
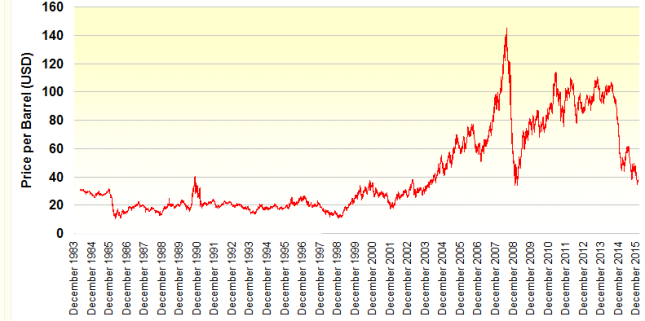
I have looked into two major prices impacts: on 1998 and 2009.
Those years show significant low prices for oil, in 1998 the lowest price was 16$ and in 2009 the lowest price was 33$, now let’s put those prices with Rig Counts data
* this data is taken from bakerhughes.com
1998
1998 |
Latin America |
Europe |
Africa |
Middle East |
Asia Pacific |
Total Intl. |
Canada |
U.S. |
Total World |
Jan |
276 |
109 |
82 |
165 |
187 |
819 |
481 |
993 |
2293 |
Feb |
269 |
114 |
81 |
165 |
180 |
809 |
507 |
974 |
2290 |
Mar |
271 |
102 |
82 |
165 |
186 |
806 |
390 |
932 |
2128 |
Apr |
266 |
105 |
83 |
169 |
182 |
805 |
128 |
886 |
1819 |
May |
258 |
98 |
86 |
169 |
187 |
798 |
157 |
855 |
1810 |
Jun |
260 |
107 |
79 |
164 |
180 |
790 |
238 |
854 |
1882 |
Jul |
241 |
86 |
68 |
171 |
165 |
731 |
217 |
816 |
1764 |
Aug |
227 |
91 |
67 |
169 |
168 |
722 |
211 |
792 |
1725 |
Sep |
219 |
108 |
61 |
170 |
174 |
732 |
187 |
774 |
1693 |
Oct |
209 |
91 |
67 |
160 |
159 |
686 |
153 |
734 |
1573 |
Nov |
212 |
87 |
68 |
164 |
158 |
689 |
201 |
688 |
1578 |
Dec |
213 |
85 |
62 |
160 |
151 |
671 |
248 |
647 |
1566 |
Avg. |
243 |
99 |
74 |
166 |
173 |
755 |
260 |
829 |
1843 |
2009
2009 |
Latin America |
Europe |
Africa |
Middle East |
Asia Pacific |
Total Intl. |
Canada |
U.S. |
Total World |
Jan |
381 |
93 |
58 |
274 |
238 |
1044 |
377 |
1553 |
2974 |
Feb |
374 |
81 |
59 |
264 |
242 |
1020 |
413 |
1320 |
2753 |
Mar |
358 |
95 |
61 |
262 |
236 |
1012 |
196 |
1105 |
2313 |
Apr |
349 |
86 |
62 |
253 |
236 |
986 |
74 |
995 |
2055 |
May |
357 |
82 |
62 |
253 |
239 |
993 |
72 |
918 |
1983 |
Jun |
343 |
77 |
64 |
247 |
236 |
967 |
125 |
895 |
1987 |
Jul |
351 |
73 |
57 |
249 |
244 |
974 |
175 |
931 |
2080 |
Aug |
344 |
78 |
58 |
234 |
233 |
947 |
178 |
980 |
2105 |
Sep |
355 |
83 |
57 |
245 |
246 |
986 |
208 |
1009 |
2203 |
Oct |
351 |
84 |
62 |
239 |
247 |
983 |
244 |
1044 |
2271 |
Nov |
361 |
86 |
68 |
253 |
257 |
1025 |
277 |
1107 |
2409 |
Dec |
353 |
84 |
70 |
251 |
266 |
1024 |
313 |
1172 |
2509 |
Avg. |
356 |
84 |
62 |
252 |
243 |
997 |
221 |
1086 |
2304 |
What would be now in 2016?
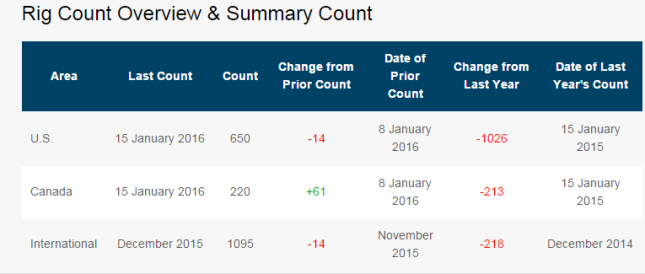
From the last count on the 15th of January, we can see something interesting and this is related also to usd/cad price:

From the technical side:
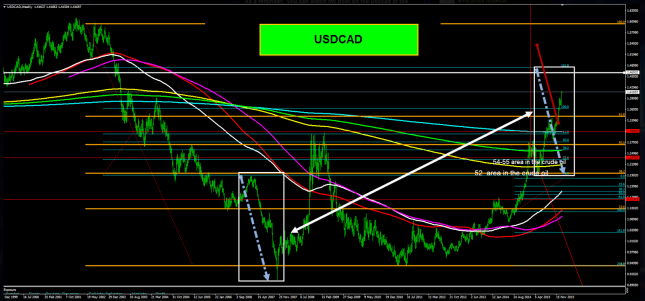
Let’s test the Canadian dollar compatibility, we will see oil prices within the past weeks when the currency follows strong moves by the expectation. At the moment, I expect for radical moves don’t surprised if the amendment to the level of 1.24 + _ equivalent to the level of 51-4 oil prices.
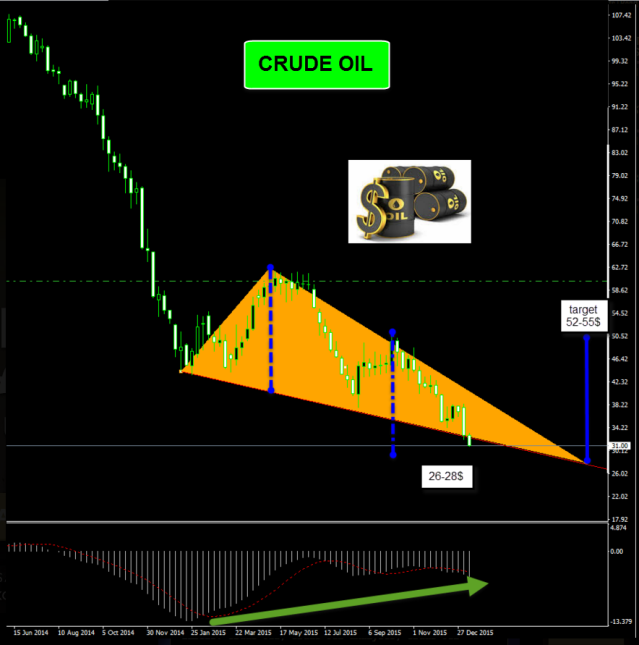
If oil will move more than that we need to expect even stronger repair more at the level of 1.19 + _”. Another leg up in the usd/cad will lead to 1.46+_ or 1.48-90 (With an option to continue the level from 1.54 to 55). The 1.46-1.48 Area hand by hand with crude oil to 26-28 prices. Oil chart is in Type of building wedge, it could leading to prices corrections over 50$. Another thing that watched in Canadian dollars charts. Now, remains to be seen whether this time too it will come…… If it would, then I predict targets, 1.24-1.19 in usd/cad area with oil prices in 51-55.


But when the news is the worst ….. Is it the time to buy, or maybe it’s the time to sell?
This review does not including any document and / or file attached to it as an advice or recommendation to buy / sell securities and / or other advice
www.daytrade-profit.com

