GBP USD TECHNICAL ANALYSIS
GBP USD rallied against the dollar and reached higher level since August after EU negotiators were said to the Brexit agreement try to make it more palatable to the Britain side.
from the other side, the pound has been buffeted by Brexit headlines in recent sessions, oscillating between gains and losses in volatile trading as investors attempt to interpret contradicting headlines about Britain’s prospects of reaching a deal by March.
Brexit headlines make volatile trading as investors attempt to interpret contradicting headlines about Britain’s prospects of reaching a deal by March – Rumors of commentary and more will accompany this move, which will determine the future of the pound
 |
| GBP USD TECHNICAL |
GBP USD Technical analysis
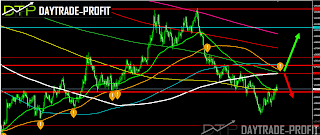
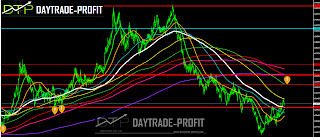
Long-term chart is showing to us that As long as GBP USD will stay below 1.3920+_ Key support the trend is down Below 1.3130 price area, it could bring larger down trend resumption, while we have first to meet 1.3020. On the downside, break of 1.2840 support will indicate short-term topping. If it will fail to stay above the level, it will be turned back to the downside for 1.2640 support current and below
Short-term chart as a long as GBP USD will trade above 1.3020 the next resistance will stay on 1.3320-1.3450+_, those are the areas for topping correction after the long decline from 1.4360
 |
| GBP USD CHART |
 |
| GBP USD ANALYSIS |
COT position map :
From looking at the positions map you can see a few things
The behavior is very similar to what happened towards the end of 2016
If this is the case then we can expect a further recovery of the GBP against the areas listed above
 |
| GBP USD position map |
 |
| GBP USD TRADERS POSITION |
This review does not include any document and/or file attached to it as an advice or recommendation to buy/sell securities and/or other advice
www.daytrade-profit.com

