

🟡 GOLD Overextension Alert: A Rare Price Dislocation from the Mean
📅 Date: October 15, 2025
📌 Key Insight: Gold Is Trading at Extreme Distance from Long-Term Averages
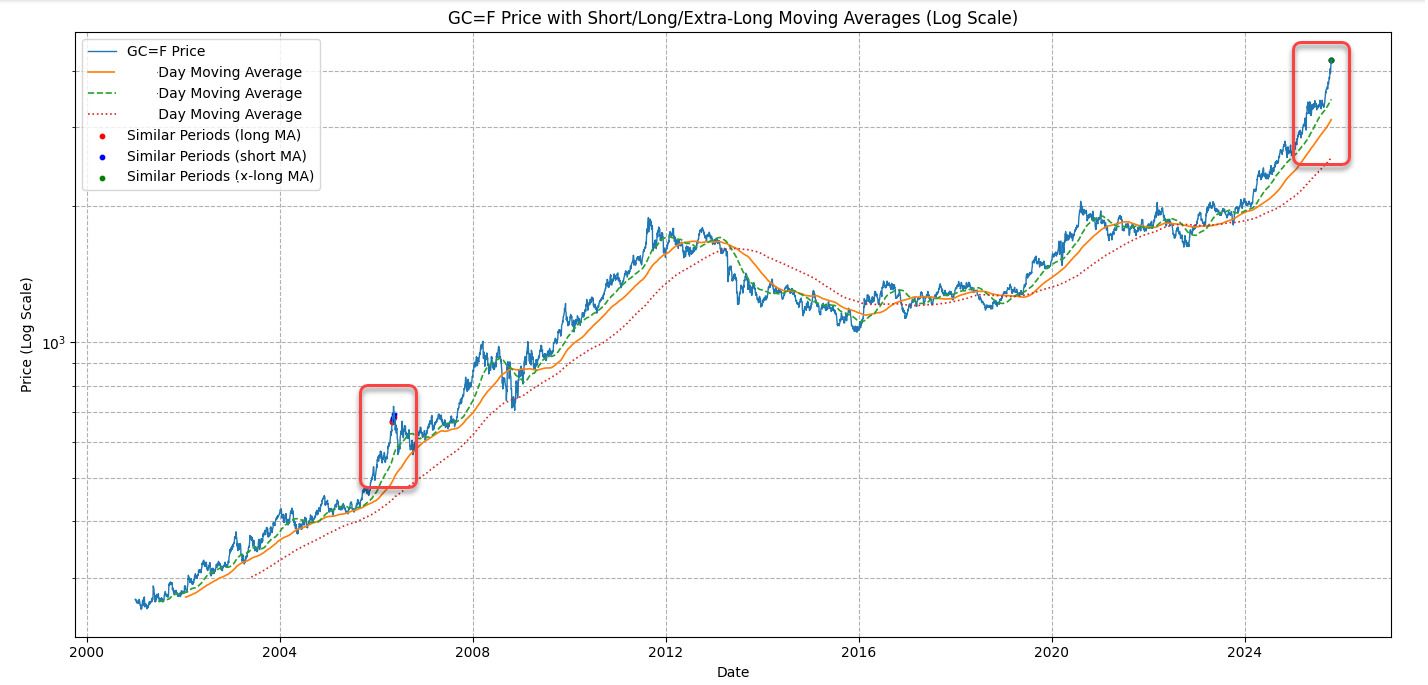
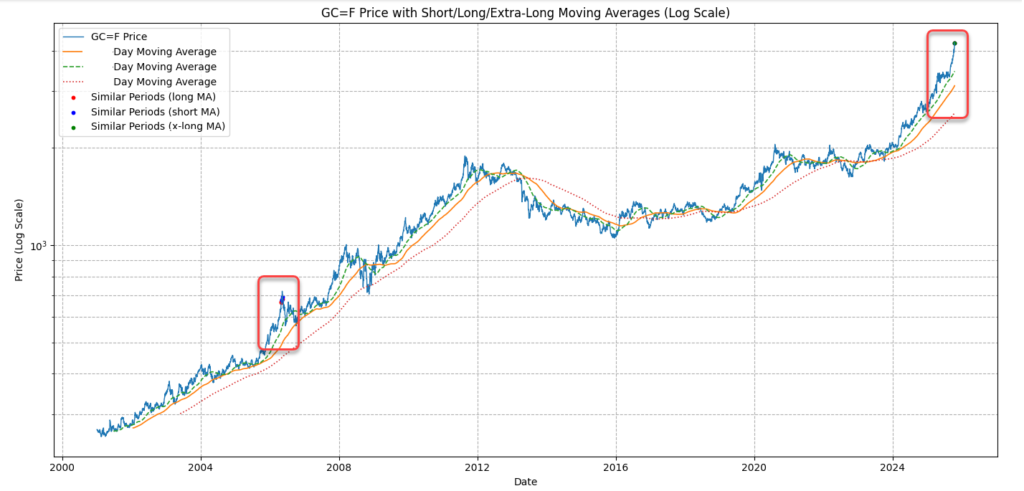
The chart below tracks the percentage distance between Gold (GC=F) and its key moving averages. The current reading is flashing a historical red flag: Gold is now trading 35.65% above its long-term moving average and 22.24% above its short-term moving average — a level that has only been exceeded once in over 20 years.
🔍 Chart Breakdown
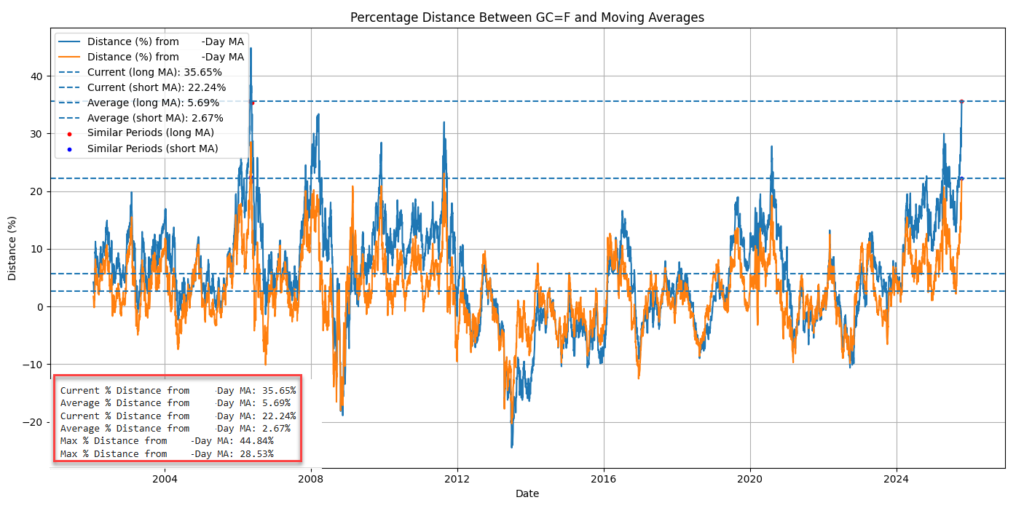
✅ Metrics from the Lower Chart (Distance % from MAs):
| Measure | Value |
|---|---|
| 🔹 Current Distance from Long MA | 35.65% |
| 🔸 Current Distance from Short MA | 22.24% |
| 📉 Average Long MA Distance | 5.69% |
| 📉 Average Short MA Distance | 2.67% |
| 🔺 Max Long MA Distance | 44.84% |
| 🔺 Max Short MA Distance | 28.53% |
The last time Gold reached this kind of separation from its long-term average was during the 2005–2006 bull run, which was followed by a multi-month sideways correction before resuming its climb.
🧠 Interpretation: High Risk of Short-Term Mean Reversion
Gold is clearly in a strong uptrend, but the current deviation from historical moving averages is extreme. This distance has only occurred a handful of times since 2003, and it usually signals:
- A cooling-off period, or
- A pullback to moving averages (short or long-term)
Such extensions often precede rebalancing moves, even in powerful bull markets.
🎯 Trading Implications
🧾 Bottom Line
Gold’s price is nearly 6x above its average deviation from long-term trends.
This doesn’t mean a crash — but history suggests a mean reversion is likely.
Expect volatility, and look for lower-risk entries if you’re bullish long-term.
📉 Ideal Support Zones to Watch:
- $4,150–$4,180 (short MA)
- $4,000–$4,050 (long MA / prior options OI magnet zone)
- Gold COT + Options + Technical Outlook
🧾 COT Report – Strong Speculative Longs
📅 Latest Report Date: September 2, 2025
| Group | Long | Short | Net Bias |
|---|---|---|---|
| Managed Money | 127 | 21 | ✅ Very Bullish |
| Swap Dealers | 18 | 31 | 🔻 Hedging (not directional) |
| Other Reportables | 104 | 65 | ✅ Mild Bullish |
🔍 Summary:
- Managed Money (hedge funds, CTAs) are extremely long-biased, with very few short positions.
- Swap Dealers are net short, typically acting as liquidity providers rather than speculators.
- Other Institutions are net long, though more balanced.
✅ This confirms a strong conviction behind the Gold rally from the institutional side.
📊 Options Market Sentiment (OGF6)
- Put/Call Open Interest Ratio: 0.87 → Moderate bullish bias
- Put/Call Volume Ratio: 0.26 → Heavy short-term call buying
- Key OI Support Zone: $4,000–$4,200
- Current Futures Price: $4,255.50
🧠 Interpretation:
- Most call open interest lies below the current price — many positions are already in the money.
- The market is skewed bullish, but this also implies potential profit-taking or volatility spikes on any pullback.
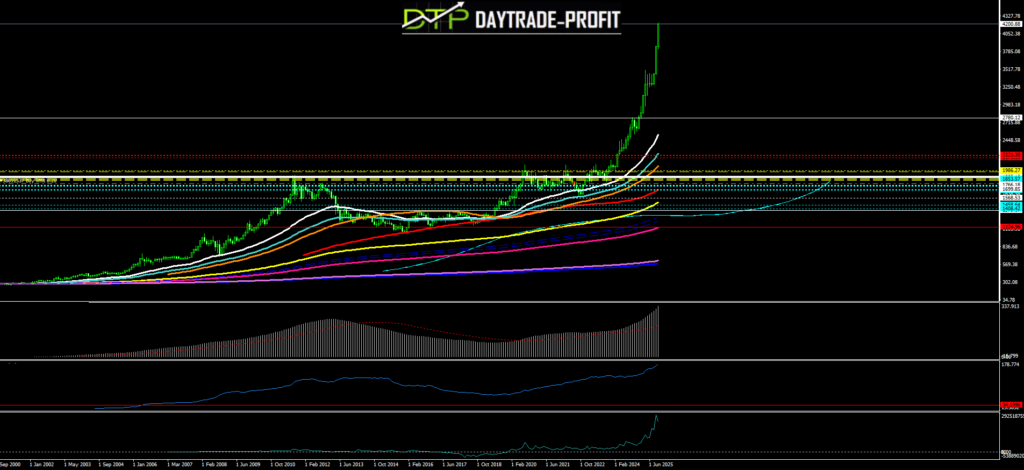
📉 Technical Structure
This review does not include any document and/or file attached to it as advice or recommendation to buy/sell securities and/or other advice
2 Comments
obsidian backlinks example
Regards for all your efforts that you have put in this. very interesting information.
admin
THANK YOU