Dow Jones Industrial Average Technıcal Analysıs
Is this the end of the journey , or should we await the top destinations ….
““let’s test and look on the Dow Jones
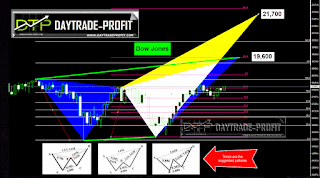
If we look at the index, we can see an interesting pattern
Here the picture looks rather more positive
Assuming that the pattern does indeed exist
There are three options that can be seen in the graph
Let’s say that the region of 19,600 points in the first phase will provide me”
 |
Dow Jones Technıcal Analysıs |
Dow Jones hıt new records yesterday ,wil the next step be above 20,000 points ,Or maybe it’s the end of the journey?
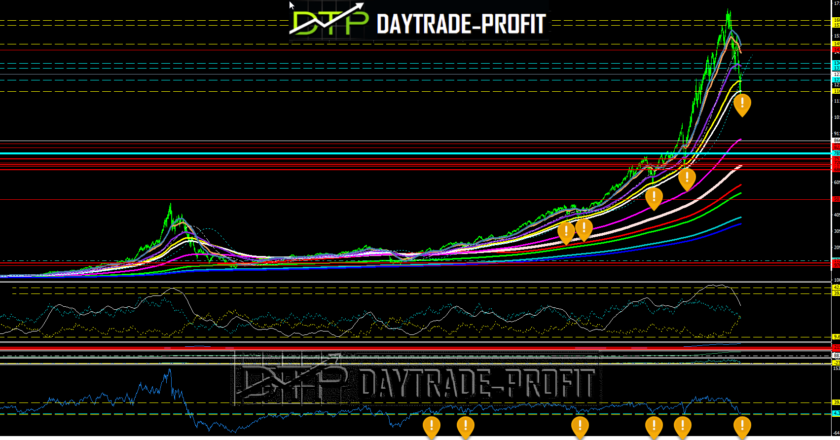
I’m beginning to see non positive signs , including the overall picture, after more than 8 years of increases, since the last crisis in 2008
Stalls angular velocity, usually do not lead to positive results in the long term, keep calm and safe movement, but rather the opposite
I have spoken several times over the past year for the years 1998-1999 imagination
If this is so – and there are signs for that!
There is a situation, and it is not small, we are close to exhaustion increases, which means that between January and March, could start corrective movement.
It could be mid-January, or alternatively the middle of the end of March 2018,
It is still too early to tell, but I’m not so calm, so I wrote it.
we Should begin to keep a finger on the trigger
Who was the last journey with me, I would advise him to begin Dow Jones maintenance release, at least by half, these numbers – it was a nice move and yielding profits
I’ll update on any change in the bıg pıcture
This review does not including any document and / or file attached to it as an advice or recommendation to buy / sell securities and / or other advice


