crude oil technical analysis forecast
Oil shows signs of inability to cope with price levels of over $ 50, what the next step Choppy trading pattern in WTI crude oil, which has lasted 14 months. As we hit Another peak, the risk/reward favor is a move back down, unless we break out Above $53.
OPEC is struggling to balance the oil market for several reasons. One is compliance. OPEC comprises a disparate group of nations united solely by their geology
 |
| crude oil pattern |
Moving to green energy:
Shell is considering a multi-billion-dollar investment in green energy. Shell CEO Ben Van
Burden stated that the company has changed its mindset to a “lower forever” oil price
Environment. A lower forever mindset means fewer capital expenditures invested in
Expensive offshore oil projects or projects in remote areas with little infrastructure and far
From refineries. These large conventional oil deposits are what currently move the oil
Production and cash flow needles for Big Oil.
Big Oil’s attraction to green energy is the long project life and cash flow stability which
Comes with it. The average life span of the wind or solar farm is 25 years. Owners of green
Energy projects can sell their power through guaranteed, multi-decade contracts called
Purchase power agreements (PPAs).
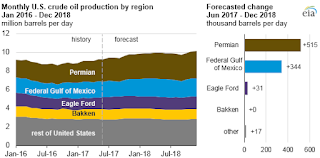
“Based on data from Baker Hughes, 366 of the 915 onshore rigs in the Lower 48 states in June were operating in the Permian region. EIA forecasts that the Permian’s rig count will fall slightly to 345 at the end of 2017 and then grow to 370 by the end of 2018.
In EIA’s latest Short-Term Energy Outlook (STEO), total U.S. crude oil production is forecast to average 9.3 million barrels per day (b/d) in 2017, up 0.5 million b/d from 2016. In 2018, EIA expects crude oil production to reach an average of 9.9 million b/d, which would surpass the previous record of 9.6 million b/d set in 1970. EIA forecasts that most of the growth in U.S. crude oil production through the end of 2018 will come from tight rock formations within the Permian region in Texas and from the Federal Gulf of Mexico.”
Cot Position Map: Positioning is highly extended: swap dealer raised bearish bets on oil for the fifth week in a row to the highest level since December; priming the market for a steep reversal- similar behavior appears in 2013 see the charts
 |
| oil position map |
technical analysis update:After the pattern archived: as I mention the last post- the pattern suggests the bullish trend, for the coming trading sessions, pointing that the prices creating a possible bullish pattern that its confirmation wti level situated at 39-40 $, from looking at the charts we can see also the resistance at 42-43 areaThis pattern also suggests some corrections after reaching the target. Breaking down 36.20 followed by 35.10 levels will send the crude oil to cope with 33-34 $look on the white strip – you can see clearly the block on the upper areas – 52-53$ prices
 |
| history crude oil |
This review does not including any document and / or file attached to it as an advice or recommendation to buy / sell securities and / or other advice


