Silver Market Overview – October 28, 2025
Current Price: $45.80
📉 Change: -0.90 (-1.91%)
Institutional Positioning (COT)
CFTC Disaggregated COT Report – Silver (as of Sept 23, 2025)
| Group | Long | Short | Weekly Net Change | Sentiment |
|---|---|---|---|---|
| Managed Money | 51,225 | 14,126 | ▼ -1,327 longs | ✅ Still Bullish |
| Swap Dealers | 25,785 | 69,717 | ▼ Net Short | 🔻 Hedging |
| Other Reportables | 21,093 | 5,916 | ▲ +729 longs | ✅ Bullish |
Total OI: 165,805 contracts
Key takeaway: Strong bullish bias remains from institutional players, but signs of some light profit-taking from managed money last week.
📉 Options Sentiment
🔹 SOF6 (December Expiry – 56 DTE)
- Put/Call OI Ratio: 0.82 → Moderately bullish skew
- OI Clusters:
- $44.00 strike → Over 800 contracts open → Key support zone
- $48–$50 zone → Light resistance from call side OI buildup
🔹 SOZ5 (November Expiry – 27 DTE)
- Put/Call Volume Ratio: 0.45 → Short-term bullish skew (buyers favoring calls)
- Max Pain Zone: ~$44–45
- Current price near OI pivot — lots of gamma-related volatility expected around these levels.
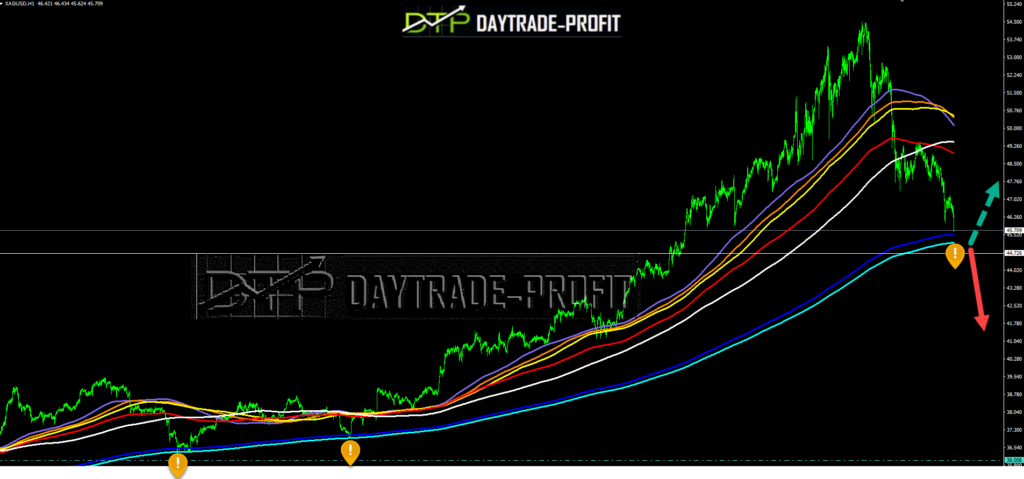
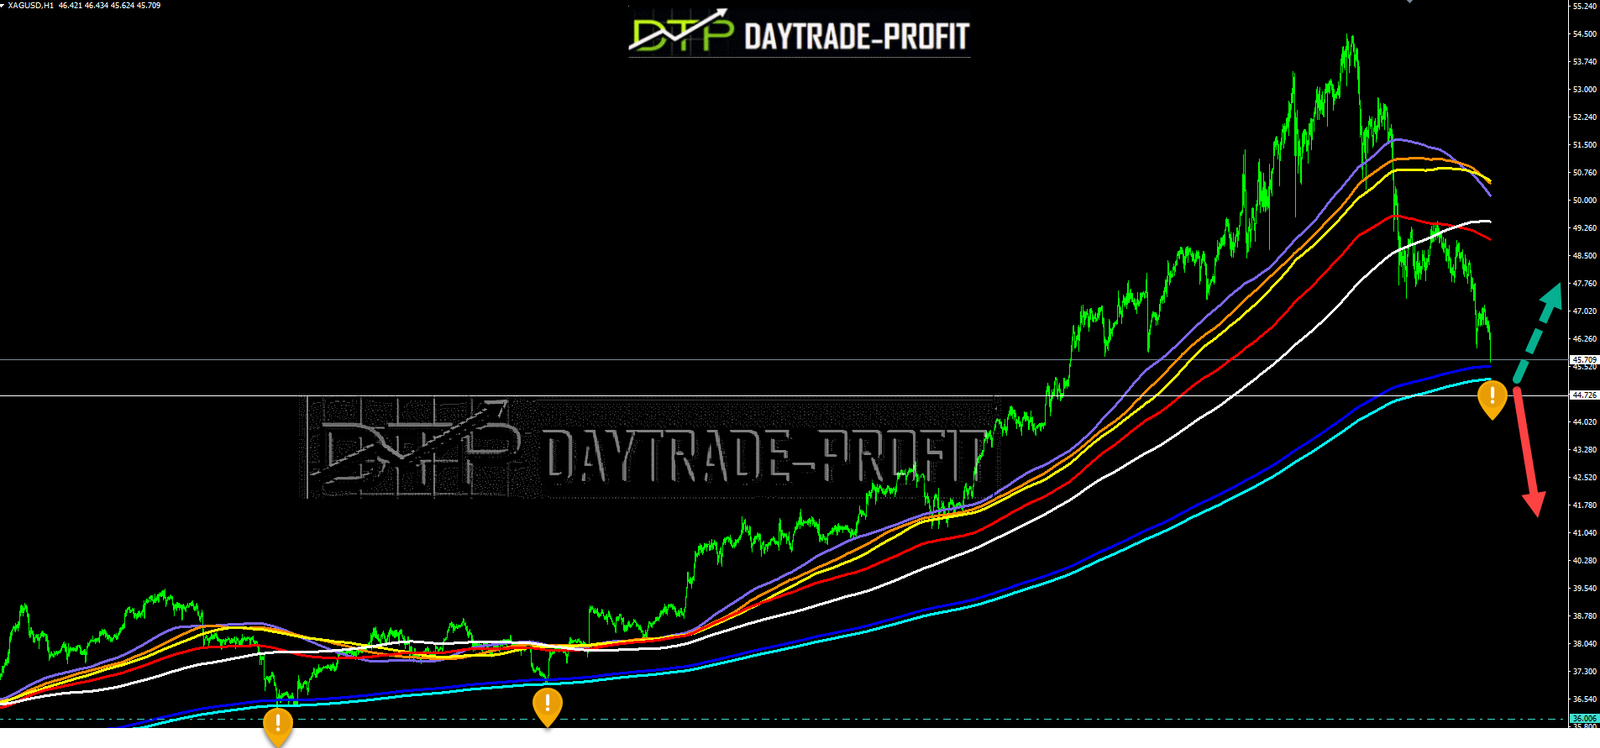
📊 Technical Analysis (Chart-Based)
🔎 Observations from Chart:
- Multi-MA Ribbon Structure
- The price has clearly broken below the medium-term moving average cluster, including the red/gold/purple bands.
- Testing the long-term trend support zone, marked by the blue and cyan bands
- Support Test in Progress
- Horizontal support around $44.10–$45.00 aligns with the long-term moving average and options OI cluster.
- Momentum appears heavy, and the next key support level could be around $43.20 or even $41.80, if selling pressure continues.
- Bearish Momentum Picking Up
- Aggressive volume selling is evident in recent bars.
- If price breaks below $44.10 with volume, further downside toward $42 is likely.
Summary: Full Market Picture
| Component | Bias | Comments |
|---|---|---|
| COT (Institutions) | ✅ Bullish | Still net long, light profit-taking |
| Options OI | 🟢 Moderately Bullish | $44.00 = strong gamma support |
| Technical Chart | ⚠️ Short-term Bearish | Testing critical long-term support |
| Price Action | ❗ Heavy selling | Near-term pressure, bounce or breakdown zone |
Trade Outlook
| Trader Type | Market Action | Strategy |
|---|---|---|
| Swing Trader | Support Test | Wait for confirmation of hold/reversal |
| Trend Follower | Still Uptrend Long | Accumulate at blue-band / $44.10 zone |
| Short-Term Bear | Momentum Favorable | Target $43.20 / $41.80 with tight stops |
| Options Trader | High Gamma Zone | Consider volatility plays or spreads |
📌 Key Levels to Watch
Bullish Invalidation: Break below $43.00 on strong volume
Immediate Support: $44.70 (technical + OI cluster)
Breakdown Target: $43.20 / $41.80
Resistance to Reclaim: $47.50 / $49.00
This review does not include any document and/or file attached to it as advice or recommendation to buy/sell securities and/or other advice