The SP500 index appears to be entering a critical phase. Current projections indicate a potential decline to the 5500-5600 range, reflecting a natural market correction or consolidation. However, this move should not be viewed purely as a bearish signal. Instead, it may act as a setup for a significant upward wave, akin to the explosive rally seen during the mid-1990s (1995-1996).
Support Levels
- The 5500-5600 range aligns with key technical support, where historical price patterns and Fibonacci retracements suggest potential buying interest.
- However, if this level does not hold, it creates room for potential further declines. In such a scenario, the downward move could extend into the 4200-4800 points area.
Potential for a Bubble-Like Surge
A correction to the 5500-5600 zone could ignite a powerful upward wave driven by:
- Renewed investor confidence
- Favorable economic conditions
- Technological advancements
This dynamic could resemble the rally of 1995-1996, characterized by speculative exuberance and rapid market growth.
Historical Parallels and Risks
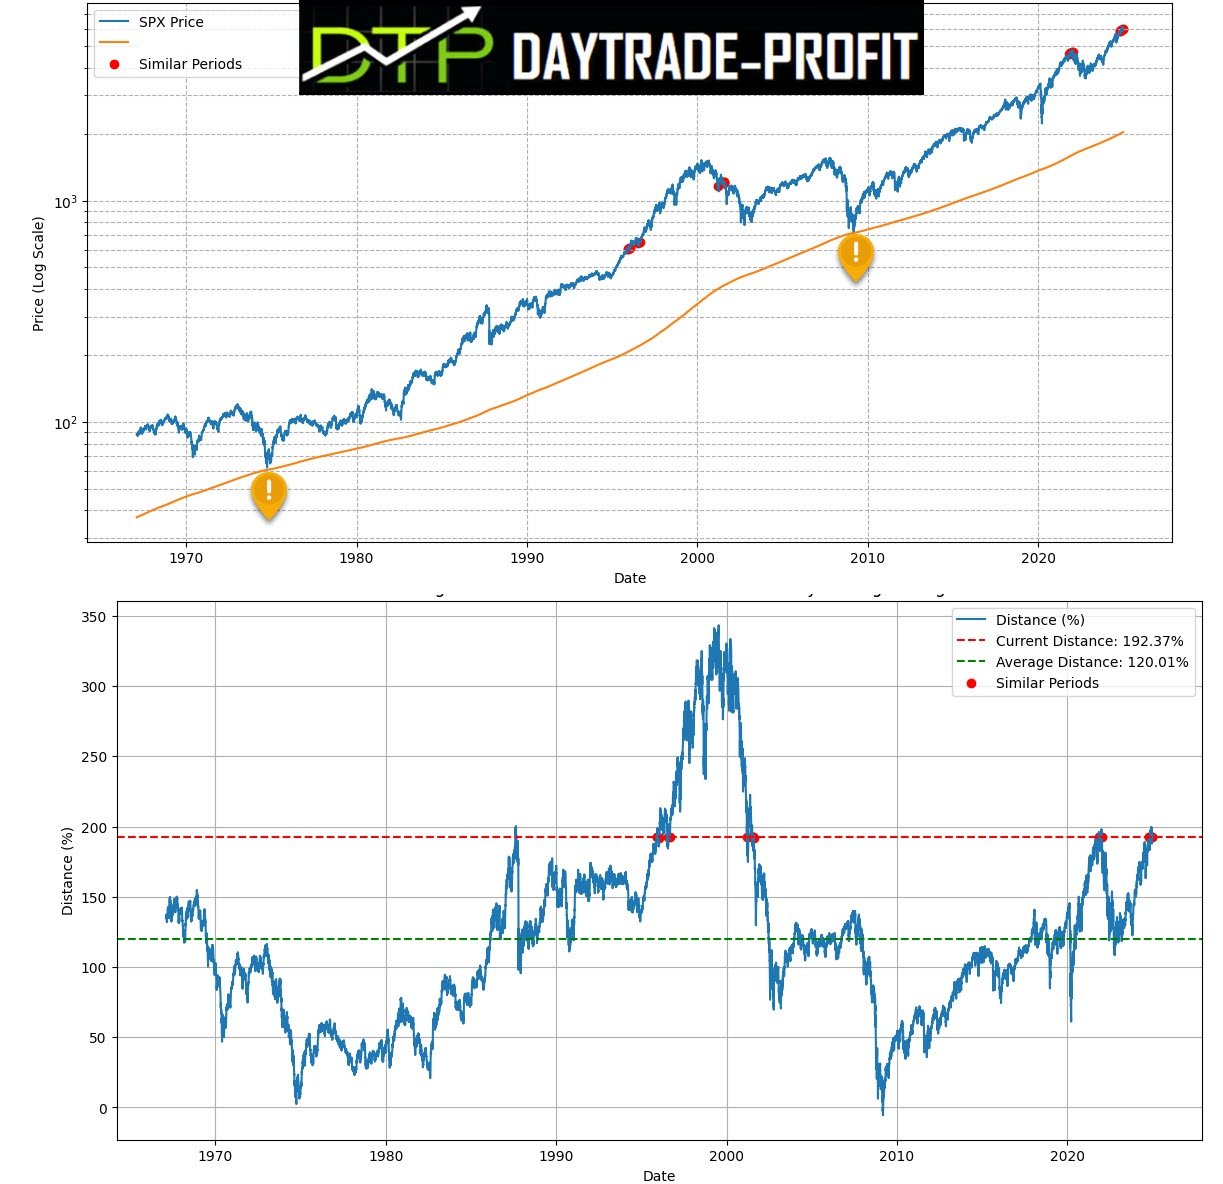
It’s crucial to recognize that the current market trajectory bears a striking resemblance to the late 1990s—a period that ultimately led to one of the most well-known market crashes in modern history.
- While this doesn’t mean a crash is imminent, it underscores the importance of preparation and understanding the associated risks.
similar periods. Displaying examples with exact dates:
DatetimeIndex([‘1995-12-26’, ‘1995-12-27’, ‘1995-12-28’, ‘1996-01-18’,
‘1996-01-19’, ‘1996-01-22’, ‘1996-01-23’, ‘1996-01-24’,
‘1996-01-25’, ‘1996-01-29’, ‘1996-01-30’, ‘1996-01-31’,
‘1996-02-01’, ‘1996-08-15’, ‘1996-08-16’, ‘1996-08-19’,
‘2001-04-11’, ‘2001-05-01’, ‘2001-07-26’, ‘2001-07-27’,
‘2001-07-30’, ‘2001-07-31’, ‘2001-08-01’, ‘2001-08-02’

Investor Guidance
Investors should consider the following risk management strategies:
- Portfolio Diversification: Spread investments across multiple asset classes.
- Stop-Loss Orders: Limit potential losses by setting predetermined exit levels.
- Monitor Indicators: Keep a close eye on macroeconomic indicators, market sentiment, and historical parallels to navigate potential volatility effectively.
Conclusion
While the SP500 may experience a near-term decline to the 5500-5600 area, this correction should be viewed as a healthy retracement rather than a cause for alarm. Historical precedent and current market dynamics suggest the potential for a subsequent, bubble-like surge, offering substantial opportunities for savvy investors.
Cumulative growth from 1995-12-26 to 2001-08-02: 98.72% – Predicted price based on similar growth to 12072.59 points – sounds crazy

Maintaining a disciplined approach and focusing on long-term trends will be critical in navigating this complex but promising market phase.
Stay tuned for further updates on this evolving market scenario.
This review does not include any document and/or file attached to it as advice or recommendation to buy/sell securities and/or other advice