crude oil price analysis
Oil trade below $ 20 until when and is this the end?
Let’s dive straight into the technical perspective
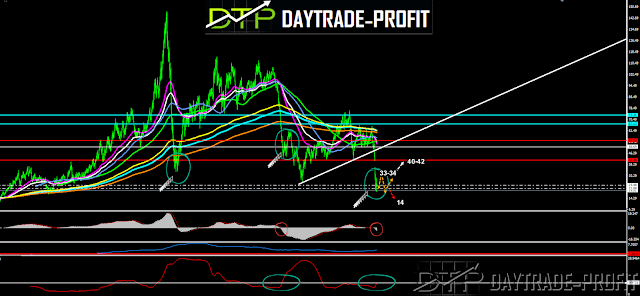
The scenario of 2008-9 where the price plunged and remained in the 33-24 region for 3 months set a bottom and then moved up
If this is the case at the moment, then we are likely to see the oil move from 19 to 29 period and from there upwards
I tend to see more similarities in terms of technical parameters for 2015 in the expected movement
If we trade this scenario, which is actually more interesting then it should be done in the following way
Price ranges from $ 19 to $ 34 but different from what it was in 2008-9, and what I mean: This Monday we will move to see the June contract oil prices and why I should point it out: Because the difference is huge – at the time of writing it is more than 6 .7 $
This means on the price graph, we will see oil quoted at a price level of $ 26.7 when nothing happened, this is not a price increase you will earn from it, not at all – but from what I see then the scenario that should lead here is the first scenario of the two
The price of oil below is direct to $ 34 and from there back to the $ 20 area, examining the level of support in the 19-20 area and exiting the move towards closing the gap in the 40 area
The second scenario is like this: Next week the price of a new contract in the region 26-27 from where the oil plays at a price level of up to 28.40 and then fall again to the 19-20 region and from there rise to a region of 33-34 $ when an inability to cross the region will send the oil at lower prices From what we see today and this is about $ 14 price levels
Trade OIL with ZERO Monthly rollover fees
Analysis of the current position maps and a combination of several factors show a relatively high $ 30 price scenario in June
This review does not include any document and/or file attached to it as advice or recommendation to buy/sell securities and/or other advice


