US Dollar analysis
The U.S. Dollar stays very vulnerable and struggled for lower numbers against a basket of major currencies as optimism increased demand for risk assets and by a positive movement toward a coronavirus vaccine
US dollar index (DXY) close to dropped to 30-month low trading at $91.10, which is close to its lowest level since 2018 – at 88.20
In the past months, most of the currencies have gained significantly against the dollar
We can see som technical pattern in the chart of the US index (DXY)
 |
| Dollar index analysis |
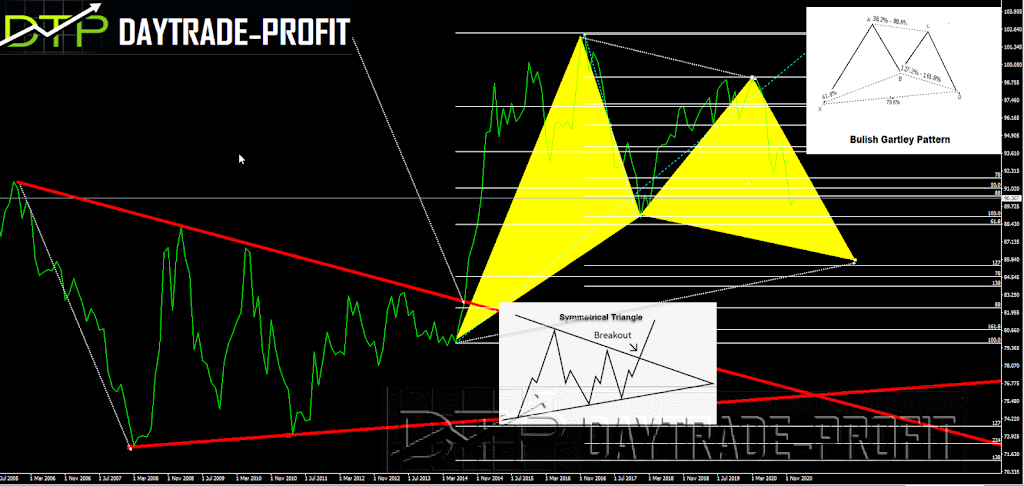
In the dollar index (DXY) , we had a symmetrical triangle, identified with a falling resistance in 2005 and a rising support trend line in 2007. Prices start to move within a tight range before the break-out occurs. The price target is the measured distance of the first high and low of the triangle, projected from the break out of the symmetrical triangle.
We can clearly see that the target of the triangle has been completed = height, which gave the dollar maneuvering the index is rising towards the peak area in 2016
Now let’s look at the picture right now technically at the moment the dollar index is in an interesting position A short and medium-term shows us a downward trend But there is a strong support point in the 88.20 area that also appeared in 2018. On the other hand, there is the resistance point that is currently in the region of 91.60 + _: only a break-in of the above region will lead to a positive move Another thing worth noting is the Bullish Gartley technical pattern- the target of the pattern is in the 85-86 range, and it quite connects to another point of equilibrium that sits on another equilibrium strip
 |
| Dollar index |
This review does not include any document and/or file attached to it as advice or recommendation to buy/sell securities and/or other advice

