GOLD Technical Analysis
Since November, gold has strengthened, combined with the strengthening of the dollar around the world, many are concerned about the strong dollar, there is a correlation between the dollar and the metals; however, both have rallied together for the past few months.
Following the latest review post: Will the third time happen gold will not hold and collapse or the melody will return?
Gold price technical analysis
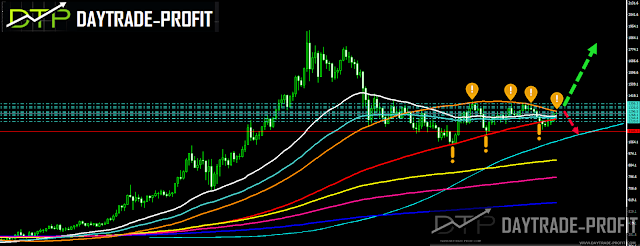
As long as gold XAU/USD stays and trade below 1319+_ the trend is bearish, if gold will cross up above 1319 I am expecting to meet 1460 areas
There is a major supporting price band imprisoned between 1207 and 1223 Strong support: 1224 & 1211 price areas are meaningful numbers and the big trend support stay in 1243
Correction is more than welcome but…… in my opinion, it’s the only correction!
Gold closing below $1209 will be sent him to lower numbers the first immediate target could be $1180, $1145, $1045, and then $931.
 |
| Gold analysis |
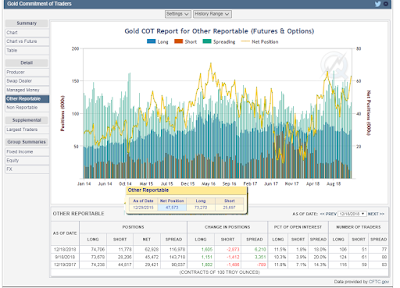
cot position :
You can see a pattern of action similar to what happened in 2016, will this happen again?
Notice the positions that were then and now
If so it is going to be interesting for the yellow metal
 |
| GOLD position |
This review does not include any document and/or file attached to it as an advice or recommendation to buy/sell securities and/or other advice
www.daytrade-profit.com

