Stock Markets Technical Analysis
Earlier this month I posted this :
Will seasonal Volatility September return again this year?
Now let’s look again for examining more details
The statistics do not lie and this time too we accepted the move
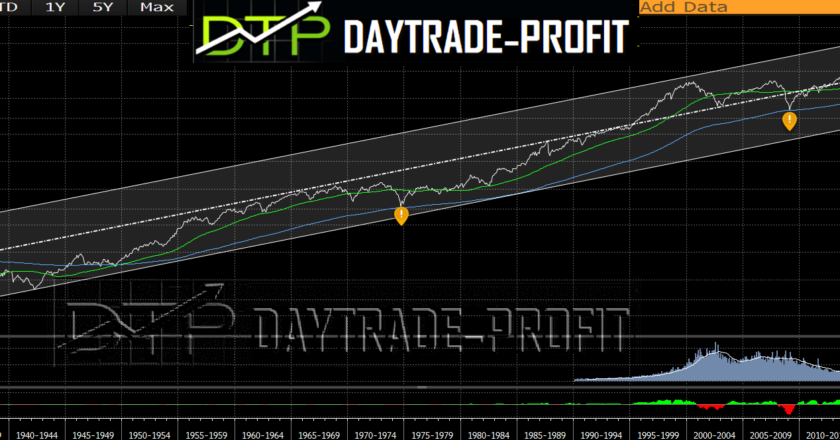
I tend to analyze the market mainly by technical data and less by fundamental data because the price on the charts usually embodies the events, so when the exciting news was published about evergrande group -the largest real estate company in China – which has debts of $ 300 billion, and the possibility of default, worried investors around the world, fearing its possible collapse, It will shake the real estate market in the second-largest economy in the world, and it will have far-reaching effects. It was not surprising in this case that here, too- the charts show us that we should expect corrections
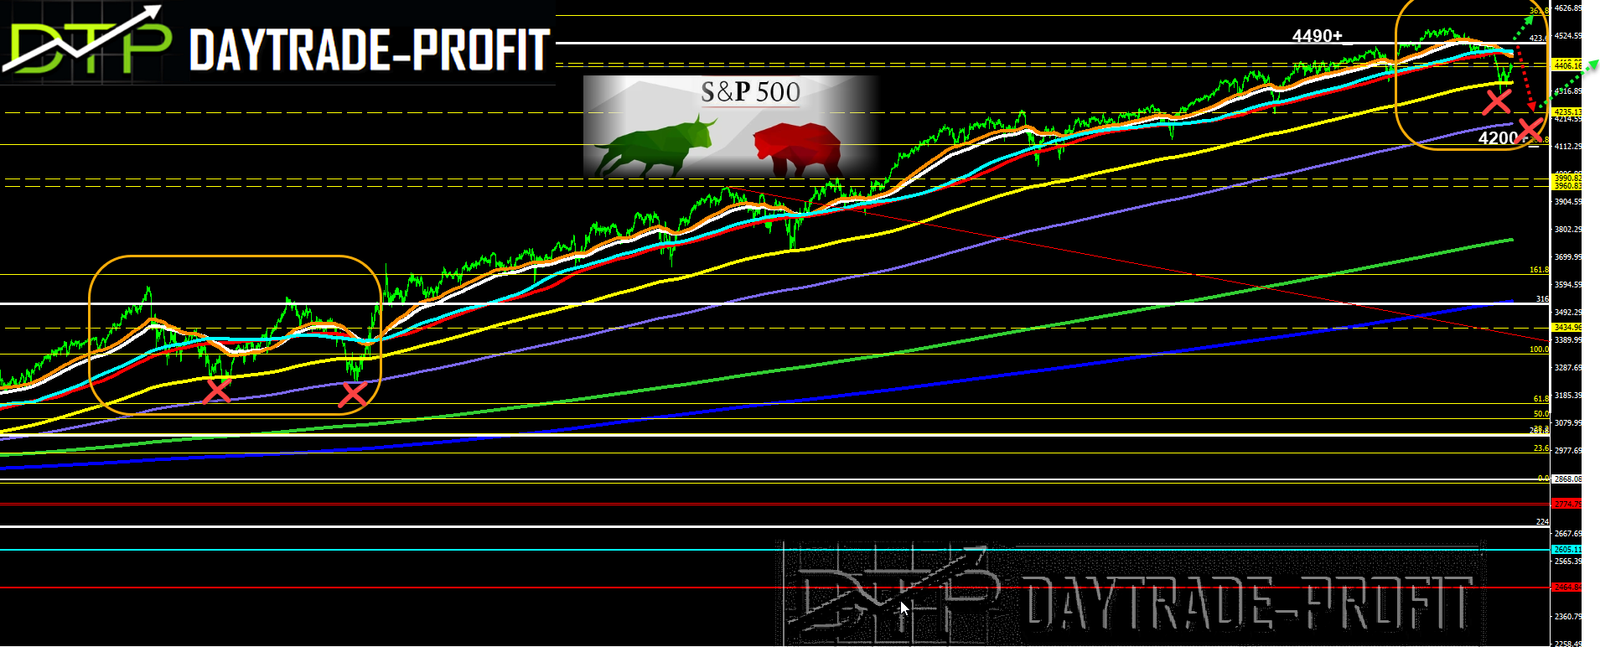
Now pay attention to the following similarity – last September I already said …. If we look at things,we can now expect two scenarios:
The first one: Exit for correction rises, towards levels 4460-4490, and from there back to check lower levels, and critical on the graph, in terms of support levels and long-term bands, when breaking the previous low, in area 4293 can lead to area 4200 + _, and there as in September – October last year, End of descending correction and return to ascending moves, Emphasis on 4200 levels if this level will break down then you should expect a continuation of descending to 4080 points area
The second option is to end the descending correction and return to an ascending move when in order to approve this move, we will need to see a daily close above 4490 area In terms of continuous movement of price levels, it can be seen that we have not yet reached a significant examination of critical levels

This review does not include any document and/or file attached to it as advice or recommendation to buy/sell securities and/or other advice


