

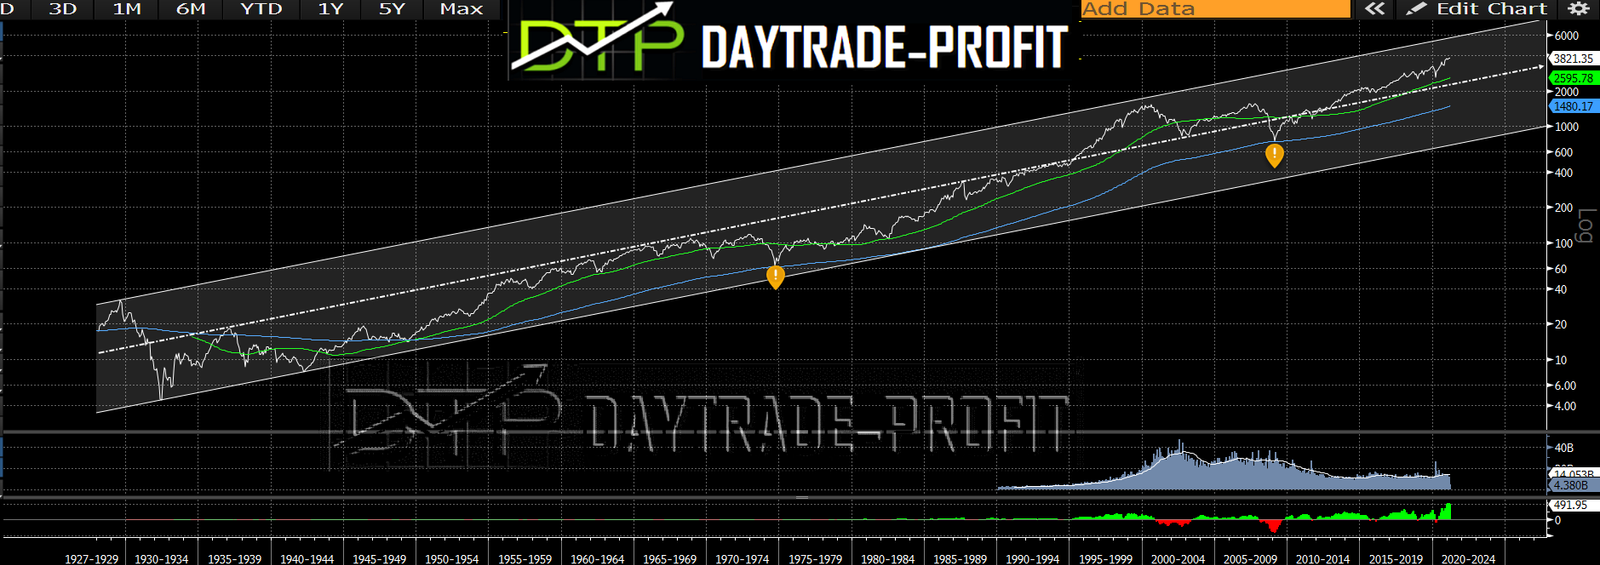
S&P 500 Technical Analysis
A lot of people are talking about the length of time the index is rising, and it is not possible that so many years we are in a rising market trend to all those who say this, I can say that from 1974 to 2000 there was a rising market trend -26 years. Let’s test our case by time – 12 years have passed since 2009 the markets rising- it is not close to 26 years record but what is more Interesting is the distance from the equilibrium point and long-term average bands – you can clearly see that we are not at the top or bottom the glass ceiling is currently in the range of 5900-6200 points this means in life everything has to be taken in proportion…..
now let’s check the status for the short term I see Kind of a bull wedgeIf area 3870 -3880 for the brave = long on a daily closing basisFor those less risk-seeking daily closing above 3910Target area 4100It’s in green glassesOn the other hand in the red glasses, the inability of the index to pass will send the index to area 3710 again and if there is a break then in my opinion we will see the area 3580-3590

This review does not include any document and/or file attached to it as advice or recommendation to buy/sell securities and/or other advice