EUR USD TECHNICAL ANALYSIS
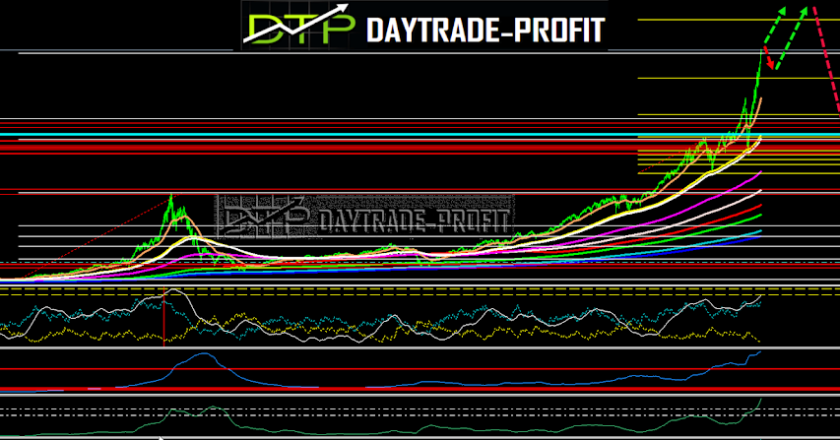
short term optimistic: in the other hand, The confirmation of the closing price reversal bottom is potentially bullish. Typically, this chart pattern leads to see some rally trend. Its first upside target to check 1.1350-1.1430+_, closing up above this price will mark new high targets
in the long term picture, the outlook remains bearish for EUR/USD as long as he trades below the long trend line in 1.27
show the pattern that appear last post
 |
| EUR USD ANALYSIS |
EUR USD TECHNICAL ANALYSIS
Double top chart pattern or Or kind of Bullish Gartley Pattern?
are we have a double top formed on the EUR USD . Notice that we have a well-defined neckline support level as well as a subtle “M” shape that has been carved out as a result.
in this scenario, we would have waited for the market to break or crack the neckline in 1.180+_
you should Notice how the EUR USD currency pair reacting after retesting the neckline.
A measured move objective can be used to find a potential profit target. To find this you simply take the distance from the double top-up resistance level to the bottom and extend that same distance beyond the neckline to a future, lower point in the market- in this case, its equal to 300+_ pips = 1.0560-70+_
On the other hand, a breach of the 1.1350-1.1430 area has been established from above
Give the EUR USD fuel for further increases to the 1.1960 area and perhaps even more to the 1.27 region while break down 1.1060-80 price area again will lead to more downtrends
* My assumption is that we see fictitious increases that will not hold unless you see that the euro continues to move on to the next hurdle – until then, this is a negative trend correction, and nothing more.
 |
| EUR USD FORECAST |
This review does not include any document and/or file attached to it as advice or recommendation to buy/sell securities and/or other advice
www.daytrade-profit.com