Finance markets forecast prediction for the 2018 year
My suspicion is that the complacency and low volatility in 2017 will not repeat same as was last years – last 2-year prediction was even better than I expected
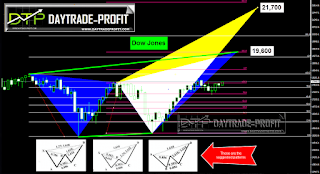
““I will focus on Dow JonesAs updates and during 2016 – watched new heights few interesting things, step up could be at 20,300 pints +_ or even further to 21,700 pints +_”
 |
Finance markets forecast |
2018 forecast from my view: in contrast to previous years my prediction this time is not so optimistic, there is a probability of over 70% that the markets are going to reach a correction:
The first option is a healthy correction that will lead markets and markets to new highs ahead
A second option is a sharp correction that could lead to a crash in the markets
 |
| dow jones forecast |
Let’s say there are more risks than chances if you look unemotionally, what he will bring with him, that 2018, could be a year full of surprises and possibly even sharp changes
Some of the trends that supported the excess performance in the markets in recent years may change in the coming year.
Political and geopolitical risks in the world: UK Brexit, Elections in Italy Risks in the Middle East, North Korea, Russia,
GOP tax cuts bringing a massive revenue shortfall that could lead the US heads into recession If Trump’s promises, to create new jobs, and moving factories back to the US will not bear fruit – Without the reform of US economic growth, it is expected to continue at a moderate rate in 2018 and reach a soft landing thereafter. With the reform, it is expected to happen in the years 2019-2020 but with greater intensity.
Looking at 2018 monetary policy tightening In the US and approval of the tax reform are expected to strengthen the dollar – see 1999 as sample to what we can experience in the markets
The moderation of the increase in new jobs and a moderate increase in wages reduced the growth rate in consumer income. Spending grew faster. As a result, consumer savings fell to one of the lowest levels in the past 20 years
The Federal Open Market Committee raised the current fed funds rate to 1.5 percent in December 2017. It expects to raise this interest rate to 2.1 percent in 2018, 2.7 percent in 2019, and 2.9 percent in 2020.
The Fed began reducing its $4 trillion in Treasurys in October, those acquired these securities during quantitative easing, which ended in 2014. Since the Fed is no longer replacing the securities it owns, it will create more supply in the Treasurys market. That should raise the yield on the 10-year Treasury note. That drives up long-term interest rates, such as fixed-rate mortgages and corporate bonds, But Treasury yields also depend on demand for the dollar. If demand is high, yields will drop.
 |
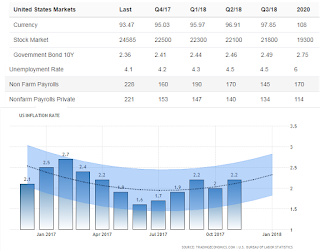
| market statistic |
 |
| index yield vs unemployment rates |
Now let us move to the real stuff, the charts story and see the technical analysis viewpoint:
I was focused on Dow Jones during 2017 – watched new heights and the markets achieved this.
thinking the trend of rising risk – the latest move was based on expectations, not on facts but as you all know -Stock market moves are following expectations
Buy a rumor – that’s the word
The reality of the facts and the moves is much slower
Let’s see market-tested from the technical side:
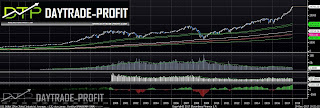
we can see few interesting things -for nowadays the trend is up – no doubt, but you should pay attention to 23,100 points, step down there could bring for corrections in the markets to 21,300 pints +_ or even further to 20,400 points
as long those points hold the trend is up, not argue with chart price s +_
Pay attention to index yield and slope when:
The standard deviation is measure of the volatility of the investment
Notice the movement that took place in the last crash – we are beginning to approach the extreme levels that were measured at that time
If the picture reflects what is to come then: we can expect more increases in the index, but not over time
The parallel in terms of schedules can bring us another month of increases to extreme levels and from there … Caution is required!
Levels of 25300-26700 are perceived by me as maximal levels of traffic ahead of market execution or correction
In my opinion, there is a probability of over 70% that the correction is at the gate
Substantial levels are found in 23,000+_ points
 |
markets forecast |
one more thing about stocks :
Euphoria on Wall Street in the belief that stocks will simply keep breaking records, again and again, becomes so exaggerated that it reaches a level that previously signaled a fall.
Analysts are raising their forecasts for US corporate profits at the fastest rate in more than a decade, according to research firm Spok Investment Group, which usually happens just before the start of the reporting season. Although the forecast increases could also be reflected in the outlook for the US economy, in the past such an optimistic atmosphere among analysts preceded the market declines.
The last time the gap between analysts who raised forecasts and those who lowered them was so high in May 2010. At the same time, the gap widened after the S & P 500 index (+ 2,747.71 + 0.17%) rose more than 10% in the previous three months. Just before analysts’ optimism reached a peak, stock prices also reached a record high, and from there the index fell more than 15%.
see stock prices since last 2008 collapse
 |
| stocks price |
Few words on crypto markets – bitcoin and other coins
The rise of Bitcoin and other cryptocurrencies has been one of the most spectacular phenomena of financial markets in recent years – Chinese stock bubble of 2007 wiped out hundreds of billions vs Bitcoin 2017 is this the same story? I see the Bitcoin collapsing back into areas of $ 7800$ or even lowe to 3800$ Which means sharp declines and collapse of the virtual currency for more than 70%
Every time in history one could see in retrospect the trigger for the landslides that took place
The whole subject of Bitcoin is, in my view, the result of excess printing of money in the world – zero interest rates – fear and fear of government institutions and banks, countries with an undefined rule and a poor financial system that lead the citizen to flee to such places
The question is: Is it a magic solution, does it have real value, does it reflect something and relies on something of value – because what is happening right now in the world around these virtual currencies is not something realistic and normal – what would happen if someone big wanted to meet with the money? (Rumor has it that 5 people hold 20% of the total Bitcoin coin, it’s not normal when they will decide to meet with cash, so we’ll see if all the numbers of the virtual currencies are really an exercise value or just a high number on the price table
 |
| BITCOIN FORECAST |
This review does not including any document and / or file attached to it as an advice or recommendation to buy / sell securities and / or other advice


