USD/JPY Technical Analysis
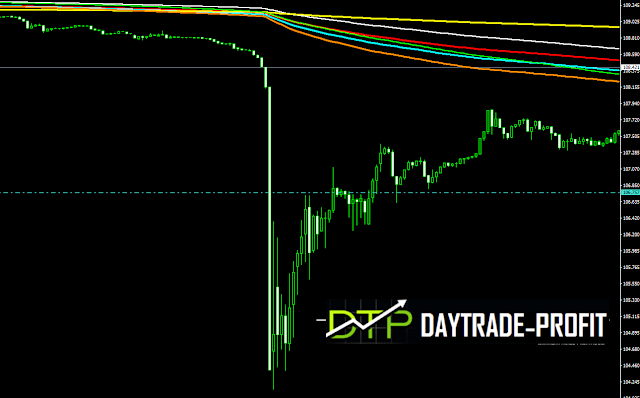
Last week It took only a few minutes for the yen to surge through levels that have held through almost a decade- fat finger case, in those minutes the yen jumped almost 4 percent against the us dollar to its strongest since 2009
Whatever the cause, the moves were exacerbated by algorithmic programs and thin liquidity with Japan on holiday.
The haven asset has strengthened – Yen strength has to cement the status of the yen as the only true safe haven as it was always in history when amid political risks elsewhere
In a bear market JPY supposed to snatch strong – still not happen …. But I’m pretty sure that when the falls in the markets worsen, he will join the celebration
 |
| USD/JPY Analysis |
Now the situation is not certain and we may have seen a false breakthrough here
If U.S.-China trade negotiations or U.S.-North Korea peace talks cancellations/ develop in a way that spooks investors further, then we might see the yen extend gains, jpy is perceived as very sensitive to developments on the following planes:
safe-haven demand sparked mainly by geopolitical risks, such as the political situation in Italy, the economic situation in Turkey, the apparent breakdown in North Korea denuclearization talks, trade-related concerns due to Trump’s
Technical analysis
The trend is still bearish, as long as USD JPY stays below 111.70+_ resistance. Considering bullish convergence condition only decisive if there will be break adobe 109.60 it will indicate term reversal. In such a case, the outlook will be turned bullish. On the other hand, Break down last lows of 105.30 will confirm more lows to the 100.70+_ target price, minor resistance stay in the 107.20 price area
now from the close look, you can see that in also in 2016 the pair broke down majors bands support but recover, there were a few false breaks – are we witness now the same situation but opposite?
if that the case then you should pay attention to those levels :
111.30 – a break above will confirm for more up moves!
110.20-40
109.30-70
108.50 –
107.20
106.40-70 a break down will confirm for more down moves!
 |
| USD/JPY Technical Analysis |
This review does not include any document and/or file attached to it as an advice or recommendation to buy/sell securities and/or other advice

