

Gold – Trend Change Developing, Just Not Confirmed
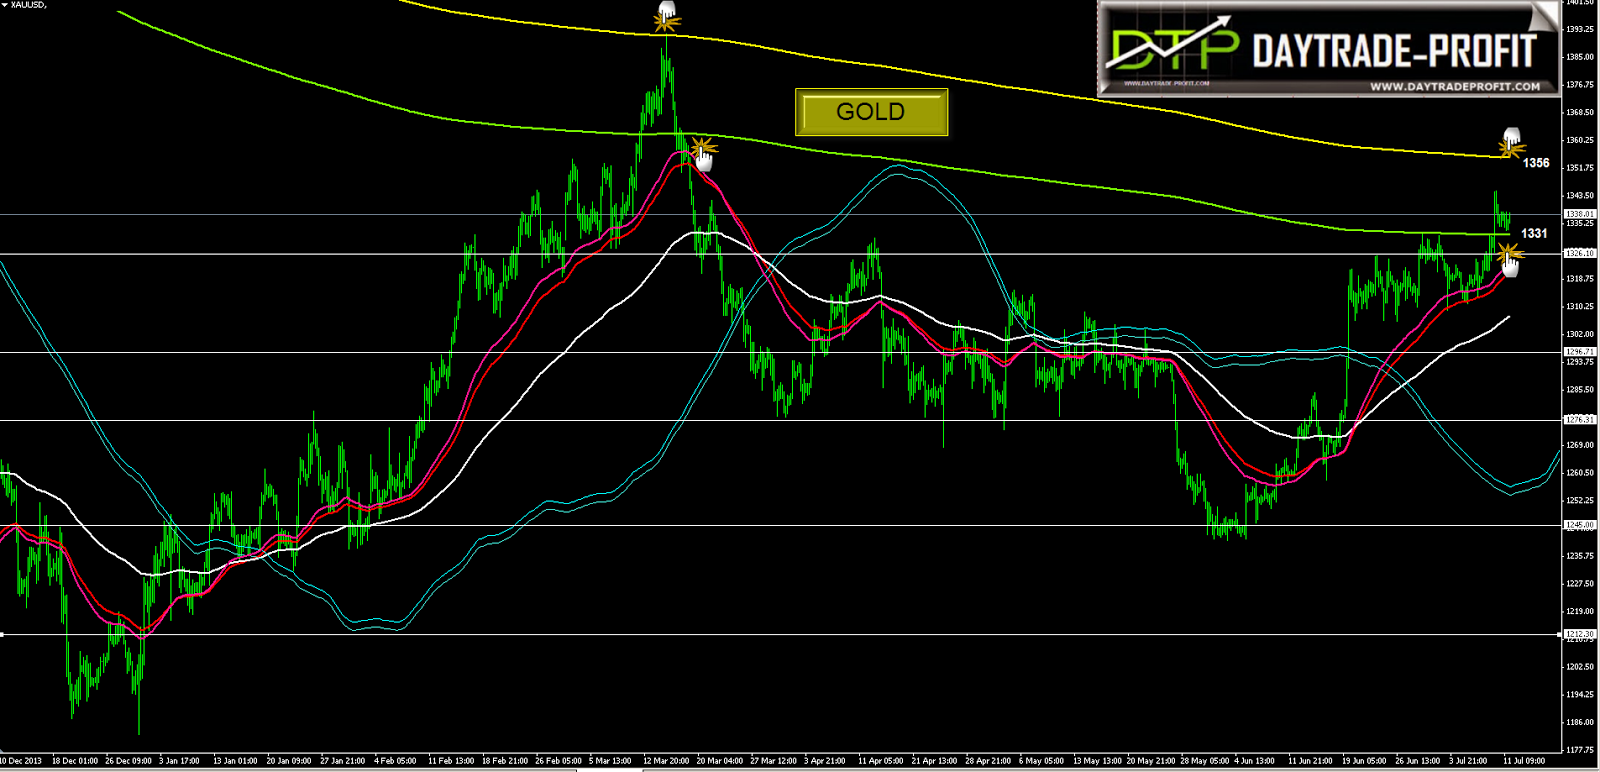
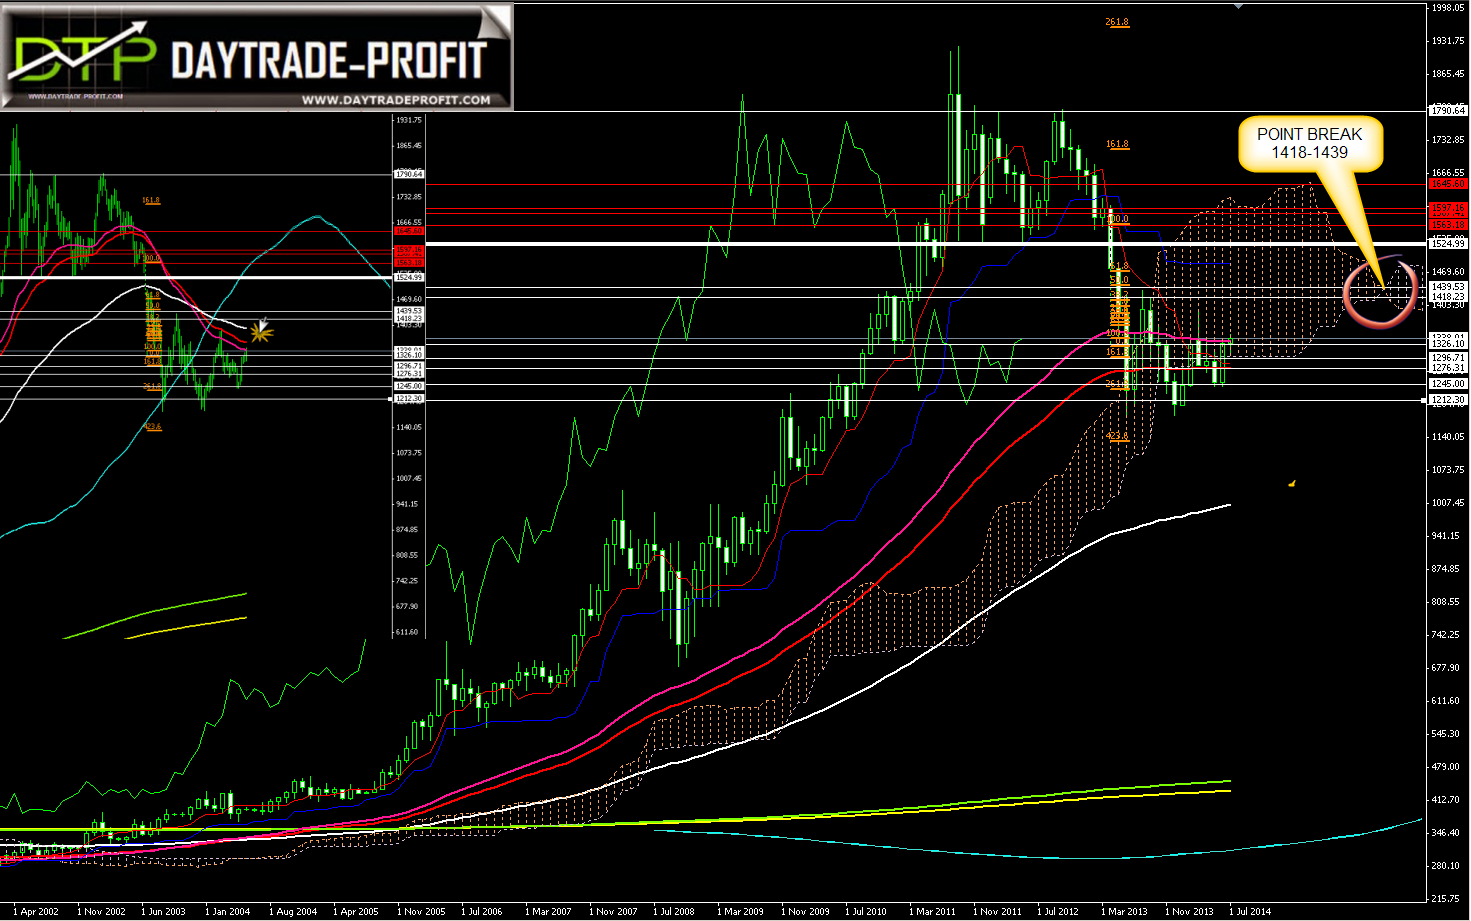
You can notice some signs that the movement is facing a turning point:net-long position in gold rose 20 percent to 136,929 futures and options contracts in the week to July 1, according to U.S. Commodity Futures Trading Commission data published last week. That’s the highest since March 18 and up fourfold since the start of the year. Short holdings betting on a drop retreated 29 percent, a fourth straight decline.Assets in bullion-backed global ETPs increased by 12.6 metric tons last week, the most since November 2012. Holdings are rebounding after six straight quarterly declines that began before gold entered a bear market in April 2013.The U.S. central bank has kept its benchmark lending rate near zero percent since December 2008, even as it trimmed its monthly bond-buying program to $35 billion, after five straight cuts of $10 billion each since November. There is no need to change current monetary policy, Fed Chair Janet Yellen said July 2. Bullion jumped 70 percent from December 2008 to June 2011 as the Fed bought debt and held borrowing costs at an all-time low.gold-futures and silver-futures speculator buying following Janet Yellen’s brazen dismissal of inflation was utterly massive. American traders flocked back to gold and silver at incredible rates, not just covering shorts as expected but adding enormous new long positions. And this all happened in the dark precious-metals sentiment wasteland of the summer doldrums no less, a very bullish omen. This represents a sea-change shift in sentiment among the futures speculators who have so dominated the gold and silver prices over the past year and a half. Gold and silver are vastly more attractive for broad investment when central banks are willing to let inflation run high for a long time. And the Yellen Fed has fallen all over itself to telegraph just that, heralding a new era of rising gold and silver investment demand.Levels can be divided into a number of steps in identifying gold tipping point In the long term trend is negative and can be seen in the graph of monthly and weekly The point in my opinion is in 1418-1439 For confirmation change of trend.1240-1280 – 70% 1280-1300 – 60% 1300-1320 – 50% 1320-1360 – 40%gold rally continued as expected as reached as high as 1340. Rise from 1240 is viewed as a leg inside the pattern from 1179. Near term outlook will stay bullish as long as 1309 support holds. Current rally will extend to 1356 if this level will break up we will see 1397 resistance and above. We’ll be cautious on reversal as it approaches 1418-1439 key resistance,decisive break of 1439 will argue that the trend has finally reversed and will turn focus back to 1525 key resistance.Critical levels: 1276 1296 1318 1331 1356
You can notice some signs that the movement is facing a turning point:net-long position in gold rose 20 percent to 136,929 futures and options contracts in the week to July 1, according to U.S. Commodity Futures Trading Commission data published last week. That’s the highest since March 18 and up fourfold since the start of the year. Short holdings betting on a drop retreated 29 percent, a fourth straight decline.Assets in bullion-backed global ETPs increased by 12.6 metric tons last week, the most since November 2012. Holdings are rebounding after six straight quarterly declines that began before gold entered a bear market in April 2013.The U.S. central bank has kept its benchmark lending rate near zero percent since December 2008, even as it trimmed its monthly bond-buying program to $35 billion, after five straight cuts of $10 billion each since November. There is no need to change current monetary policy, Fed Chair Janet Yellen said July 2. Bullion jumped 70 percent from December 2008 to June 2011 as the Fed bought debt and held borrowing costs at an all-time low.gold-futures and silver-futures speculator buying following Janet Yellen’s brazen dismissal of inflation was utterly massive. American traders flocked back to gold and silver at incredible rates, not just covering shorts as expected but adding enormous new long positions. And this all happened in the dark precious-metals sentiment wasteland of the summer doldrums no less, a very bullish omen. This represents a sea-change shift in sentiment among the futures speculators who have so dominated the gold and silver prices over the past year and a half. Gold and silver are vastly more attractive for broad investment when central banks are willing to let inflation run high for a long time. And the Yellen Fed has fallen all over itself to telegraph just that, heralding a new era of rising gold and silver investment demand.Levels can be divided into a number of steps in identifying gold tipping point In the long term trend is negative and can be seen in the graph of monthly and weekly The point in my opinion is in 1418-1439 For confirmation change of trend.1240-1280 – 70% 1280-1300 – 60% 1300-1320 – 50% 1320-1360 – 40%gold rally continued as expected as reached as high as 1340. Rise from 1240 is viewed as a leg inside the pattern from 1179. Near term outlook will stay bullish as long as 1309 support holds. Current rally will extend to 1356 if this level will break up we will see 1397 resistance and above. We’ll be cautious on reversal as it approaches 1418-1439 key resistance,decisive break of 1439 will argue that the trend has finally reversed and will turn focus back to 1525 key resistance.Critical levels: 1276 1296 1318 1331 1356
This review does not including any document and / or file attached to it as advice or recommendation to buy / sell securities and / or other device.
www.daytrade-profit.com