Strong risk appetite opening At the opening of the trading week on trade optimism after WSJ said a deal could be sealed by the end of the month.
The WSJ reported that US and China are close in on a trade agreement, which could be signed on March 27 between Trump and the Chinese President.
In the agreement, China would offer to lower tariffs and restrictions on US agricultural, chemical, auto, and other products. Specific to the car industries, tariffs on imported vehicles would be lowered from the current 15%. China would also speed up the removal of foreign ownership limitations on car joint ventures.
But so far there are practically no details on the core issues of intellectual property theft, forced technology transfer, and state-owned enterprises.
but ……. in us session the things go the opposite side :
Stocks fell sharply, many investors saying a trade deal with China is Embodied in the market and The news has been priced into U.S. equities.
I will focus on two indicators this time, in order to examine the situation in the markets and is it time to correct or is it just a pause?
Let’s start with the NASDAQ index :
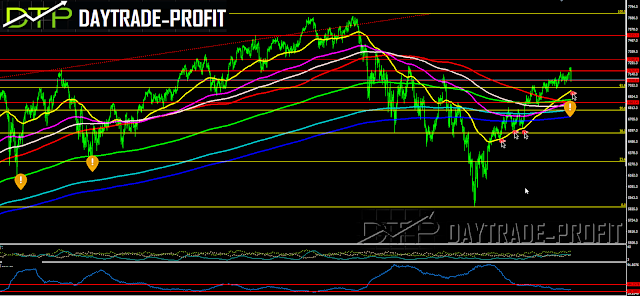
From a technical point of view, a number of critical levels can be seen in the index:
7028 6987
6880 The break of the latter will signal a return to a negative trend in my opinion
As long as these levels are traded, the correction is reasonable and healthy for a strong upward move from January
 |
| NASDAQ ANALYSIS |
We’ll move on to SP 500 index
Technically, the index can see several critical levels:
2760 2705
2684 This paragraph will signal a return to a negative trend in my opinion
As long as these levels are traded, the correction is likely and healthy for a strong move upwards from January
 |
| SP 500 ANALYSIS |
There are a few things you should pay attention to The indices reach extreme levels before the journey continues upwards, or is this the end of the correction?
Facebook has released reports yesterday and costs over 11% – comes to check the Gap, the refractive levels of the rising move: if it closes above the $ 171 area, we have a set up here to catch a move to close the top – it’s worth watching closely!
Amazon, as I have mentioned several times, should cross the 1760 area in order to show a continuing upward trend! If the conditions that I have mentioned exist, expect another incremental move
If not then the story is different:
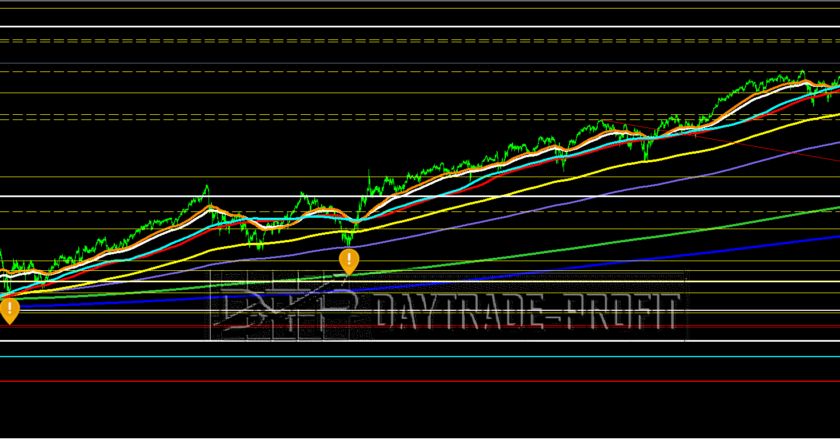
stocks markets Tracking since the last slump in the indices see below :
This review does not include any document and/or file attached to it as advice or recommendation to buy/sell securities and/or other advice


4 Comments
Arslan Saleem
Thank you I am glad about the encouragement! I love your site, you post outstanding. Buy Car Insurance – travel insurance for turkey
ExcelSHE - Letters & Templates
This comment has been removed by a blog administrator.
Excel Tmp
This comment has been removed by a blog administrator.
mis report format in excel for manufacturing company
I have a hard time describing my thoughts on content, but I really felt I should here. Your article is really great. I like the way you wrote this information.