stock markets analysis
Indices continue to break new records except for the Dow Jones, earning reporting season is almost finish -NASDAQ 100 and SP 500 has made a new all-time high
What is expected for the future, one index (DJ) is trailing behind, while the other 2 (Nasdaq +sp 500) are leading the sled of Santa Tramp, will 2 dogs chase the slow dog to increase the pace, or is he slowing down the rest of the journey?
only the Dow seems to be behind them – for getting approve on the DOW i want to see him cross 26,830 points – if so then we can get for more uptrend to 27600+_
Yesterday we saw weakness and whether it will develop into something larger or it is only a correction: Right now everything is under control
stock market approaches all-time,are we going to see new records Or it turns out to be a false one
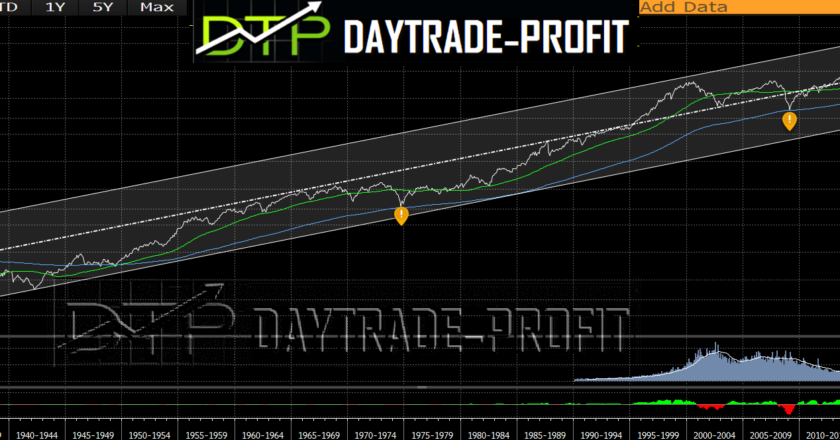
I checked past moves – rapid recovery or break-up led to a 40% to 43%
If this time, too, this is the direction – it can manage with the Dow’s goals that I gave, and then we will see the NASDAQ index rise above 8,000 points to 8200-8400
but for now, lest focus on the present because the Dow didn’t manage to cross 26830 points!
Let’s start with the NASDAQ index :
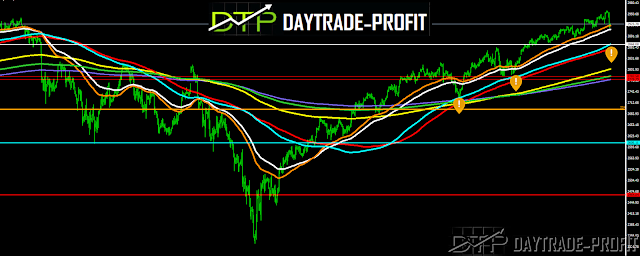
From a technical point of view, a number of critical levels can be seen in the index:
break down 7480-7530 points will signal a return to a negative trend in my opinion
As long as these levels are traded, the correction is reasonable and healthy for a strong upward move from January
 |
| NASDAQ ANALYSIS |
From a technical point of view, a number of critical levels can be seen in the index:
break down 2830-60 points will signal a return to a negative trend in my opinion
As long as these levels are traded, the correction is reasonable and healthy for a strong upward move from January
 |
| SP 500 ANALYSIS |
Facebook has released reports yesterday and costs over 11% – comes to check the Gap, the refractive levels of the rising move: if it closes above the $ 171 area, we have a set up here to catch a move to close the top – it’s worth watching closely!
Amazon, as I have mentioned several times, should cross the 1760 area in order to show a continuing upward trend! If the conditions that I have mentioned exist, expect another incremental move
If not then the story is different:
This review does not include any document and/or file attached to it as advice or recommendation to buy/sell securities and/or other advice


