As the markets continue to rally and investors keep an eye on the broader economic conditions, many of us can’t help but wonder: is history repeating itself? A recent analysis of the S&P 500 (SPX) compared to the tactical moving average reveals some intriguing parallels to the events that unfolded before the infamous dot-com bubble of the late 1990s.
Understanding the Chart: SPX vs. Tactical Moving Average
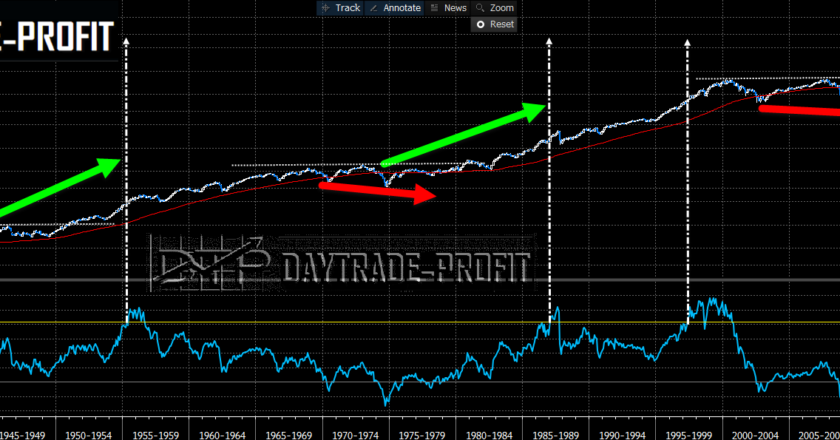
The chart above plots the SPX against its tactical moving average, highlighting key moments of deviation. The tactical moving average serves as a representation of a long-term trend line. This line smooths out short-term market fluctuations and provides insight into the overall market direction over many years.
Our recent analysis found that the current percentage distance of the SPX from this long-term moving average is approximately 197.32%. Historically, the maximum distance ever recorded was 343.31%, which occurred in July 1999, during the buildup to the dot-com bubble peak.
History Repeating Itself?

The highlighted region on the chart (leading up to the 2000 peak) shows a period of rapid growth where the SPX significantly deviated from its long-term moving average. This deviation, driven largely by exuberant market sentiment and speculation, eventually led to the infamous bubble burst in early 2000.
The current market behavior appears to be following a similar trend. The distance between the SPX and its tactical moving average has been steadily increasing, mimicking the pattern observed before 2000. This kind of deviation is often a signal of a market that is running hot and may soon face a correction.
Potential Future Scenarios
Based on the chart and the analysis, there are a few possible scenarios that we might see unfold:
Continued Rally to New Highs: The SPX may continue to push upward, potentially reaching a maximum percentage distance of 343.31% or even surpassing it. This would mean a significant rise in SPX levels, much like what happened leading up to the year 2000. Such a rally would likely be driven by ongoing market optimism and investor confidence.
Reversion to the Mean: As the SPX moves further from its long-term average, the risk of a reversion to the mean becomes more prominent. Just as the market corrected sharply in the early 2000s, we could see a similar pullback if the market becomes too overextended and sentiment shifts.
Sideways Consolidation: Instead of an immediate correction or continued rally, the market may choose a more cautious path, consolidating its gains and moving sideways for an extended period. This would allow the long-term moving average to “catch up” to the price, reducing the overall deviation.
What Does This Mean for Investors?
While history does not always repeat itself, it often rhymes. The current distance between the SPX and its long-term moving average suggests that the market is at a critical juncture. If we continue to follow the pattern from the late 1990s, there could be a final surge in prices before a major correction takes place.
For investors, this is a reminder to remain cautious. High levels of deviation from long-term trends have historically led to increased volatility and significant corrections. It may be wise to consider risk management strategies, such as diversifying portfolios, using stop-loss orders, or even taking profits if positions have grown substantially.
Final Thoughts
The market’s current trajectory bears a striking resemblance to the late 1990s—a period that ultimately led to one of the most well-known market crashes in modern history. While this doesn’t mean that a crash is imminent, it does highlight the importance of being prepared and understanding the risks involved. Investors who are aware of the past are often better equipped to navigate the future.
Will we see another 2000-style peak? Only time will tell. But for now, it’s crucial to keep an eye on these historical markers and tread carefully.
What are your thoughts? Are we headed for another peak, or will the market surprise us yet again?


