

Markets Technical analysis
in 8.2.2021 I published this markets never-ending short squeeze
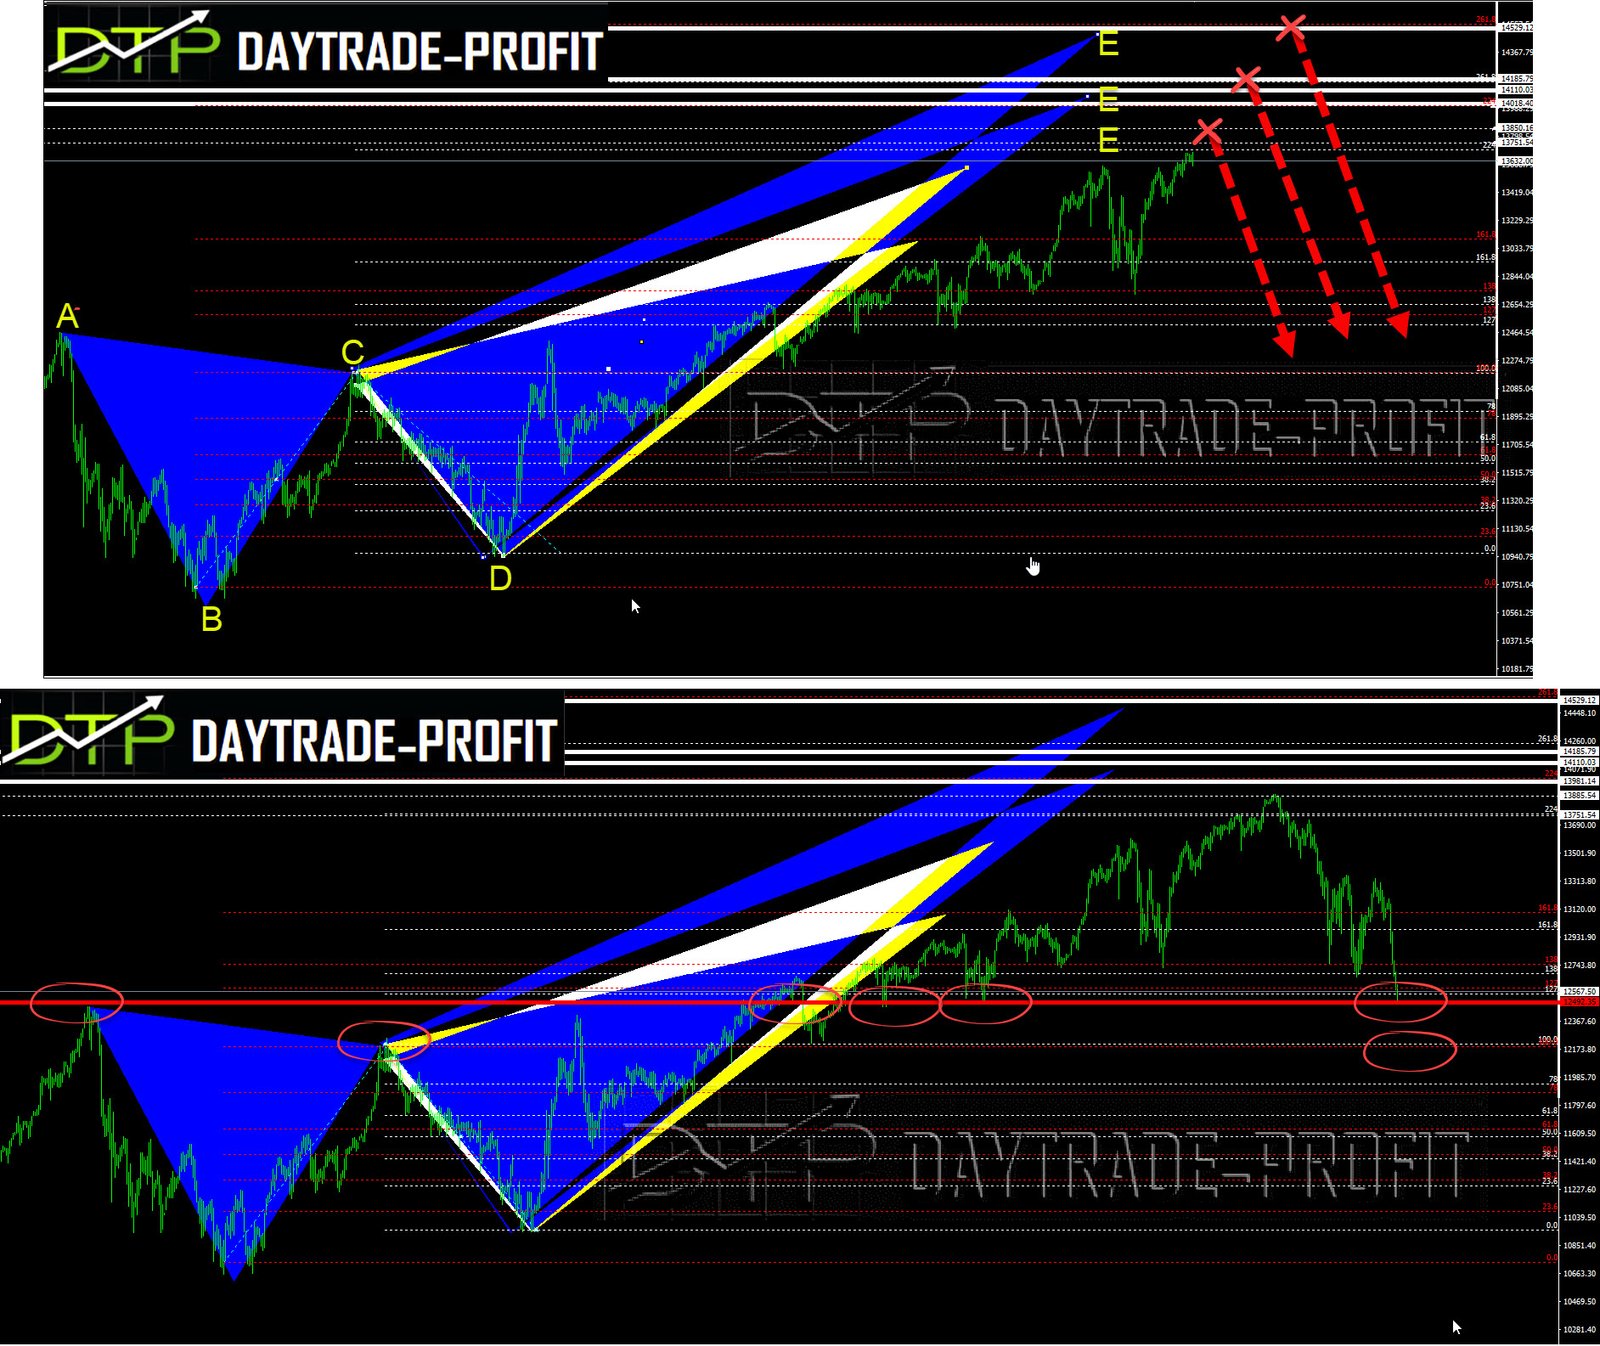
A test drive has come: NASDAQ 100: Closed below 12480 daily will sign for more downtrend while stay above is appositive sign
Are we facing a wave of exhaustion in the markets, or are we in the midst of a bubble wave?
Throughout my years in trading (more than 20 years), I tend to stick to the technical side of trading, this has proven itself more than once
Technically we are in a kind of bubble without any shadow of a doubt – the markets are in insane euphoria that does not stop, but …. does that justify it?
Covid 19 is gone?
Employment at its peak?
Countries debts at a low?
Corporate profits at their peak?
What I see today when I open charts, is something I have not seen for many years
In November when the Nasdaq was at 11,600 points I was talking about
It seems that we are before breaking records – what should we expect
new highs to areas of 13700- 14200 – 15200 points are on the way?
At the end of December, we re-examined the Nasdaq index again
The sloping picture of the gains on the graphs scares me

I want to show you also one of the biggest stock on the NASDAQ index and its apple stock we can see over their ABCD Bearish pattern – target are 108 or 99 Need to watch closely

one more thing on patterns – diamond pattern in DOW JONES index performed

and for the finale let’s check the SP 500: long trend support stay in 3580+_

SP 500 analysis
This review does not include any document and/or file attached to it as advice or recommendation to buy/sell securities and/or other advice