

Best investments for 2021
Are we facing a wave of exhaustion in the markets, or are we in the midst of a bubble wave?
Throughout my years in trading (more than 20 years), I tend to stick to the technical side of trading, this has proven itself more than once
Technically we are in a kind of bubble without any shadow of a doubt – the markets are in insane euphoria that does not stop, but …. does that justify it?
Covid 19 is gone?
Employment at its peak?
Countries debts at a low?
Corporate profits at their peak?
What I see today when I open charts, is something I have not seen for many years
In November when the Nasdaq was at 11,600 points I was talking about
At the end of December, we re-examined the Nasdaq index again
The sloping picture of the gains on the graphs scares me
 |
| markets analysis |
The Fed prints money and pours into a cheap money market that buys everything, – so who loses here if everyone wins ??? This capital market plays a zero amount one earns the other loses,
The quantities of shorts on the market are among the lowest seen on the screens
 |
| short interest analysis |
market volatility and trading volume have skyrocketed, average daily volume increase into new records – Cheap and printed money flows into the market
 |
| Nasdaq vol |
I currently see 2 options before my eyes:
The first: exhaustion that is about to come in the next two weeks, or according to the price targets of realizing the pattern I talked about in the previous post,
I went back to check it out to see what I missed?
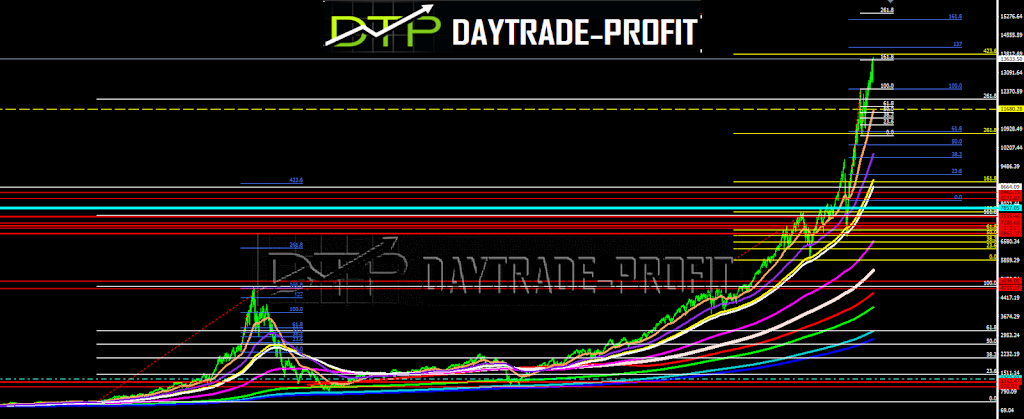
The conclusions about the pattern are the objectives of the target derivation to the area of 13530 + –
have shown were based on scenario 1 of 2 that exist in the pattern
I did not notice that BC is critical because a change in it sets a different target for price completion
if BC is 88.6% of AB,then DE can be an extension of 1.618% – 2.618% of BC
As for point E, it can have two possible destinations. It could appear either at the 38.2% 88.6% retracement of the previous BC leg. Therefore, point E also depends on where the D appears. So if point D is drawn at the 38.2% retracement of BC, the E will appear close to the 161.8% Fibonacci extension. Alternatively, a DE leg usually ends near the 224.2% extension.
it is important to use the extreme projections of 2.24 or 2.618 for the CD leg to further clarify the potential reversal zone
The pattern leaves us 3 reference points that we need to pay attention to
First area 13,800 + _
Second area 14,100 + _
Third area 14,500 + –
 |
| NASDAQ analysis |
If it’s like in 2000 then an option of continuing the increased prices about 20% + _ is on the table
 |
| NASDAQ price analysis |
This review does not include any document and/or file attached to it as advice or recommendation to buy/sell securities and/or other advice
www.daytrade-profit.com