MARKETS TECHNICAL ANALYSIS FORECAST
Let’s look at the major U.S. indices againOn 3.10.2021 I wrote a review of the expected moveIt should be noted that the forecast has been fully implemented
What next?
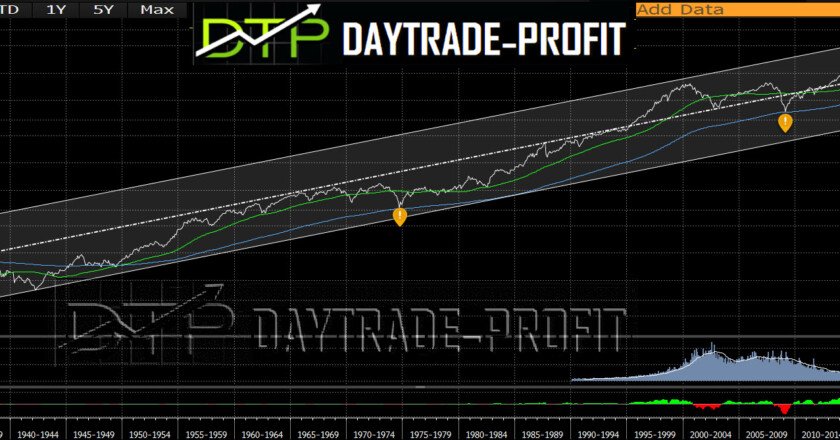
I see a lot of similarities between the moves of the end of 2019 and now in a number of parameters
Position report
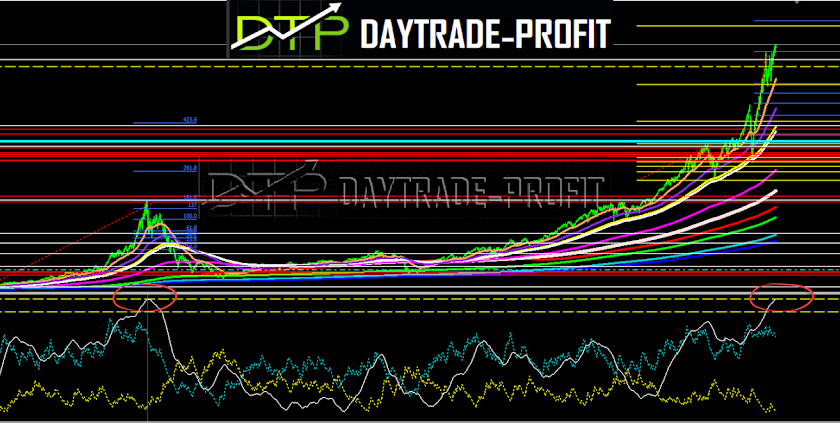
Price behavior
And several other factors
If this is indeed the case then in my opinion we will see a continuation upwards
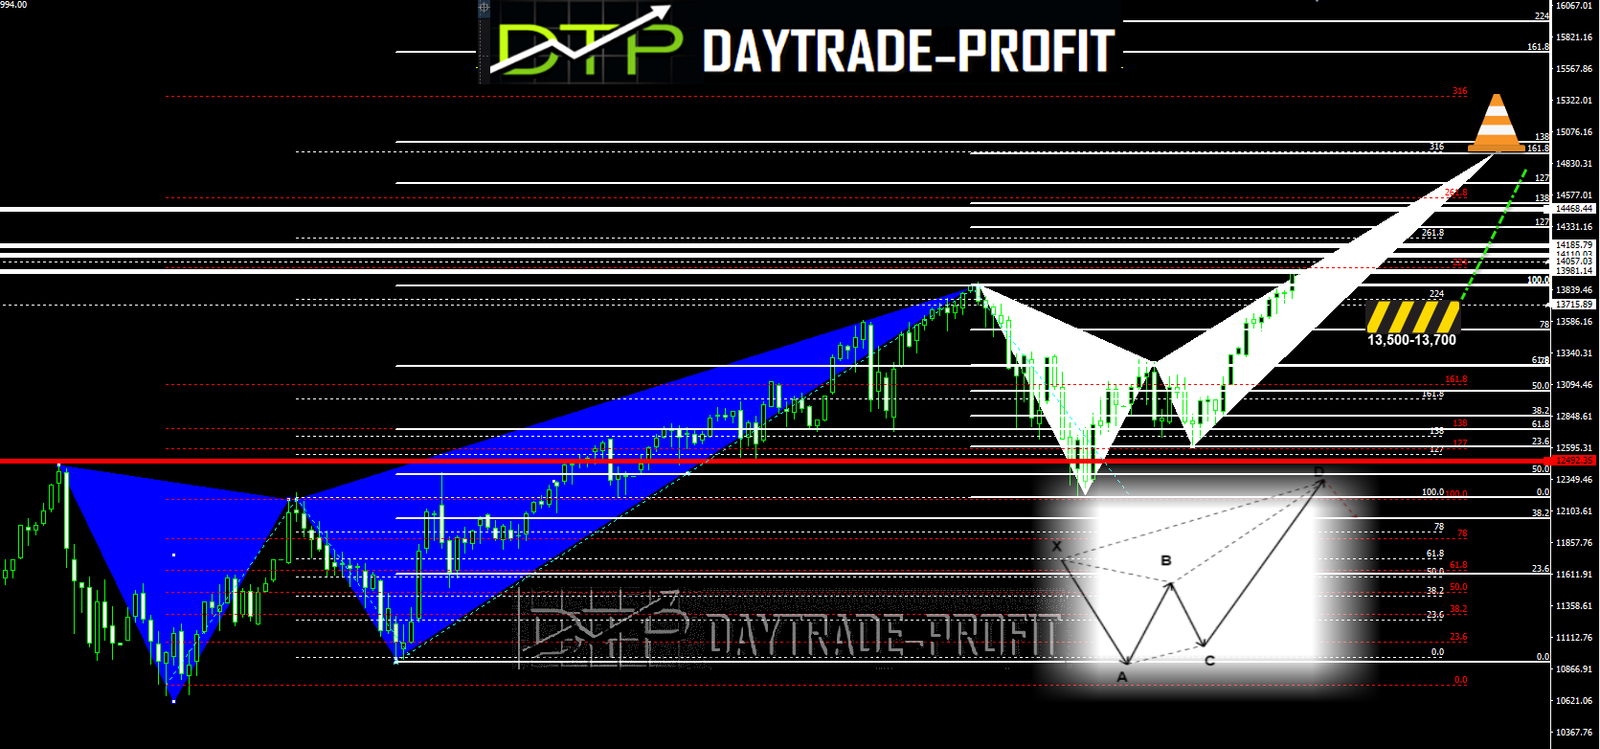
Nasdaq to 14800 + _ points
by the way, there is a trading pattern of Crab patterns structure in the NASDAQ -this can be very volatile, Therefore a bit of subjectivity is required
This means that the road there will not be continuous in a straight line – it means a bit of shaking hands
SP500 will test area + _4400 points
SP500 Leakage option for testing area -4100 when a deeper drop is also possible for testing area 4050 This is the break-in/test line – break down 4060 area on daily basis will confirm for more downtrend!
Nasdaq Leakage Option for testing Area-13700 when a deeper drop is also possible for testing area 13500 This is the break-in/test line –break down 13,500 areas on daily basis will confirm for more downtrend!

consider Odds versus risk: 2.1% +_ risk vs 5.9 % profit sp 500 rate now 4139 points Fair treatment for entering into a transaction under the current conditions(Reward over 2 times for entering a long position from the proposed loss rate)
Position report in the SP 500 see the similarity between those two moves

p.s One more thing: it is too early to know, Don’t put the cart before the horse, but it seems that after the end of the current move, we will see a deep correction in the markets * sp 500 to test 3700-3800 points …
This review does not include any document and/or file attached to it as advice or recommendation to buy/sell securities and/or other advice