Palladium price analysis news
palladium price hit into parabolic chart phase
the last post on palladium A sharp rise leads to a collapse – is that the case now?
The parabolic curve is one of those patterns which can give unbelievable returns within the shortest possible time. we will find that the trading opportunity of the parabolic curves patterns tend to occur at or near the end of a major market advance, the price action eventually ending in a downward spiral of prices that follow the steepest price advance in the curve, the steepness of the curve increases with time.
During a parabolic uptrend, there is a near-complete absence of sellers, which creates a vacuum that permits nothing else but buying activity. As prices rise, more buyers flock in. Fear is conveniently left behind as more traders rush into the trend just to get a piece of the action regardless of price.
This fast price rise is usually a sign of either panic buying or herd buying, driving prices to unsustainable levels before the rapid collapse, When an asset moves parabolic, it often marks the end of a move with prices not returning to the ultimate highs again for a long time
is 2280-2390 will be the top?
 |
| Palladium news |
Palladium Technical analysis
major trend – up
as long palladium remain above 1930 price area!
a cross below those level will confirm that correction has come and the price could move down to meet the 1130 price area
meanwhile you need to look closely and looking sign for weakness or continuation move
it will be very interesting – it Will be worth following …..
 |
| Palladium analysis |
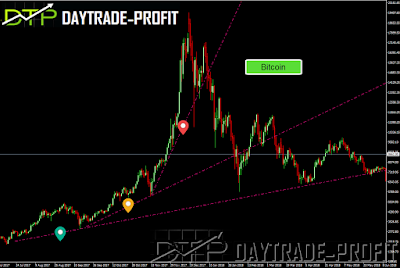
Parabolic curves will almost always get to a point of price collapse. Sometimes there is a bit of topping followed by a controlled, but precipitous decline, but other times the straight-up move reverses into a straight-down move of equal or perhaps even greater magnitude. It may be the effect of gravity, but the collapse will almost always outweigh whatever short burst of upside moves that would have previously occurred.
See 3 samples for such a move and what happened next ….
Bitcoin & china index – Chinese stock bubble of 2007 wiped out hundreds of billions vs Bitcoin 2017 is this the same story?
 |
| bitcoin parabolic |
silver
 |
| silver parabolic |
NASDAQ bubble in 2000
 |
| NASDAQ bubble |
I’ve written last year in July – Is this a replay of 2001?
This review does not include any document and / or file attached to it as an advice or recommendation to buy / sell securities and / or other advice
www.daytrade-profit.com


