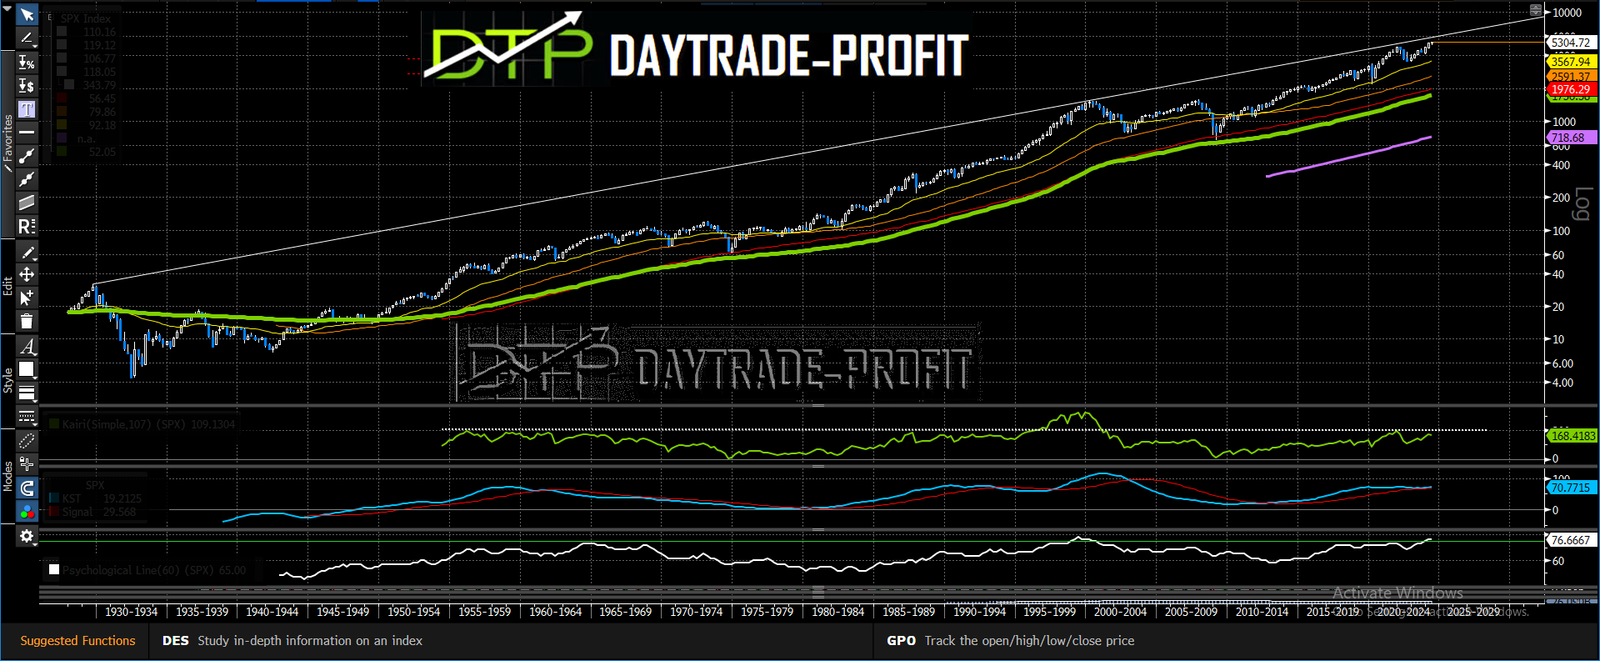
The S&P 500 in an Apocalyptic Scenario: Interpreting Harmonic Patterns Amid Global Turmoil
In today’s world, the S&P 500 is being run to a new high despite unprecedented geopolitical tensions, military conflicts, and economic uncertainty. From Middle East turmoil and U.S. election drama to the Russia-Ukraine war and China-Taiwan tensions,
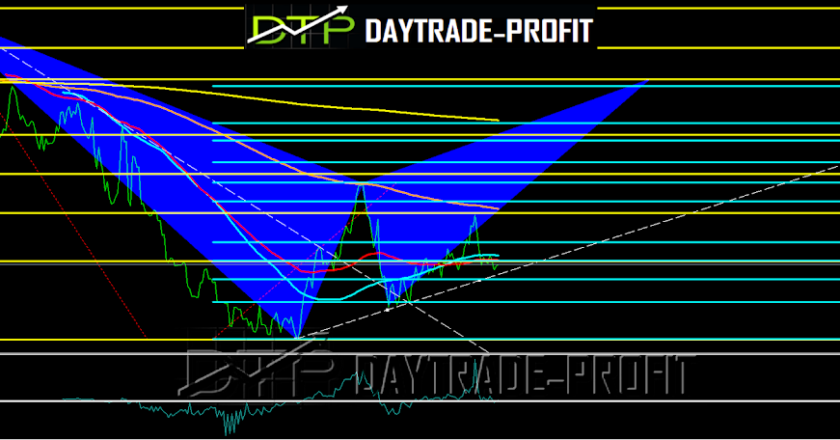
Even in such as un understanding times, harmonic patterns like the Bullish Cypher and Bullish Shark can provide valuable insights into potential market movements. Let’s break down these patterns and see what they mean for the S&P 500.
Scenario 1: The Bullish Cypher Pattern
Starting Point: ~2100 Points
Peak: ~5900 Points
Target: ~2800 Points
The Bullish Cypher is a sophisticated pattern that often signals a big market reversal. Imagine the S&P 500 starts at about 2100 points. Despite the global chaos, it skyrockets to a peak of around 5900 points. This surge could be fueled by short-term resolutions in conflicts, emergency economic measures, or speculative buying.
The Cypher pattern suggests a sharp fall back to around 2800 points. This drop reflects a sobering return to reality as the fleeting optimism wears off and the true impact of ongoing crises sets in. Investors should be ready for substantial ups and downs in the market.

Scenario 2: The Bullish Shark Pattern
Starting Point: ~2100 Points
Peak: ~6400 Points
Targets: ~2800 Points or ~1800 Points
The Bullish Shark pattern is another crucial indicator of potential reversals. Starting again at around 2100 points, this pattern shows the S&P 500 climbing to a peak of roughly 6400 points.
However, this rise is also likely unsustainable. The Shark pattern forecasts a steep drop, primarily to around 2800 points. If conditions worsen, the market could plunge further to approximately 1800 points. This reflects deeper market troubles exacerbated by prolonged geopolitical and economic instability.

Navigating Through the Chaos
Given today’s volatile global context, the S&P 500’s movements through these harmonic patterns highlight the extreme unpredictability of the market. Here’s how to make sense of it:

Key Takeaways for Investors
Monitor Key Events: Keep an eye on geopolitical events, military conflicts, and economic policies. These external factors can create significant market disruptions and opportunities.
In conclusion, while harmonic patterns like the Bullish Cypher and Bullish Shark offer valuable insights, they are Technical forecasting and none of us have a crystal ball
today’s world requires heightened caution and adaptability. The potential for dramatic peaks and deep drops in the S&P 500 underscores the need to be prepared for both short-term opportunities and long-term challenges. Stay informed, stay flexible, and navigate the market chaos with a clear strategy that considers the broader global context.
This review does not include any document and/or file attached to it as advice or recommendation to buy/sell securities and/or other advice