Markets Technical Analysis
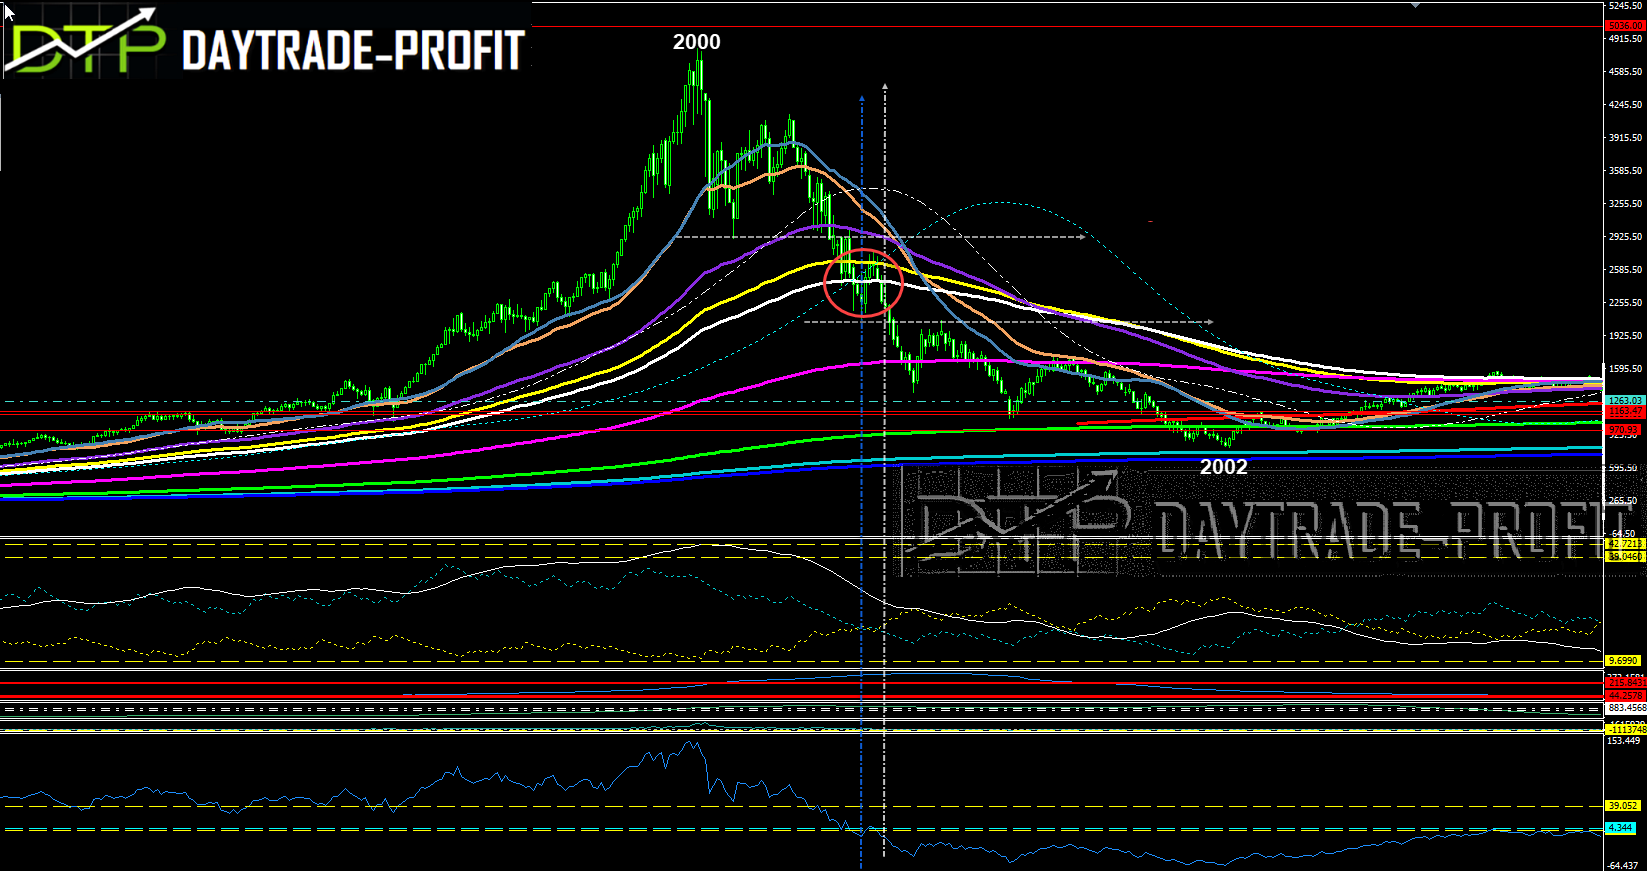
USA markets are down 9 out of the past weeks, for the third time in its entire history (1970, 1982, 2001) In 2001 it marked the start bear market rally before the bear market continued for nearly another year.
Last week after the big sale on Thursday and breaking very important support levels, Friday ended convergence, if you will look closely, you can see that QQQ’s lowest points on Friday invited buyer greed combined with a high trading turnover vol
Today there is a vacation on the US stock exchanges so there is no great significance to contracts – tomorrow we will be smarter

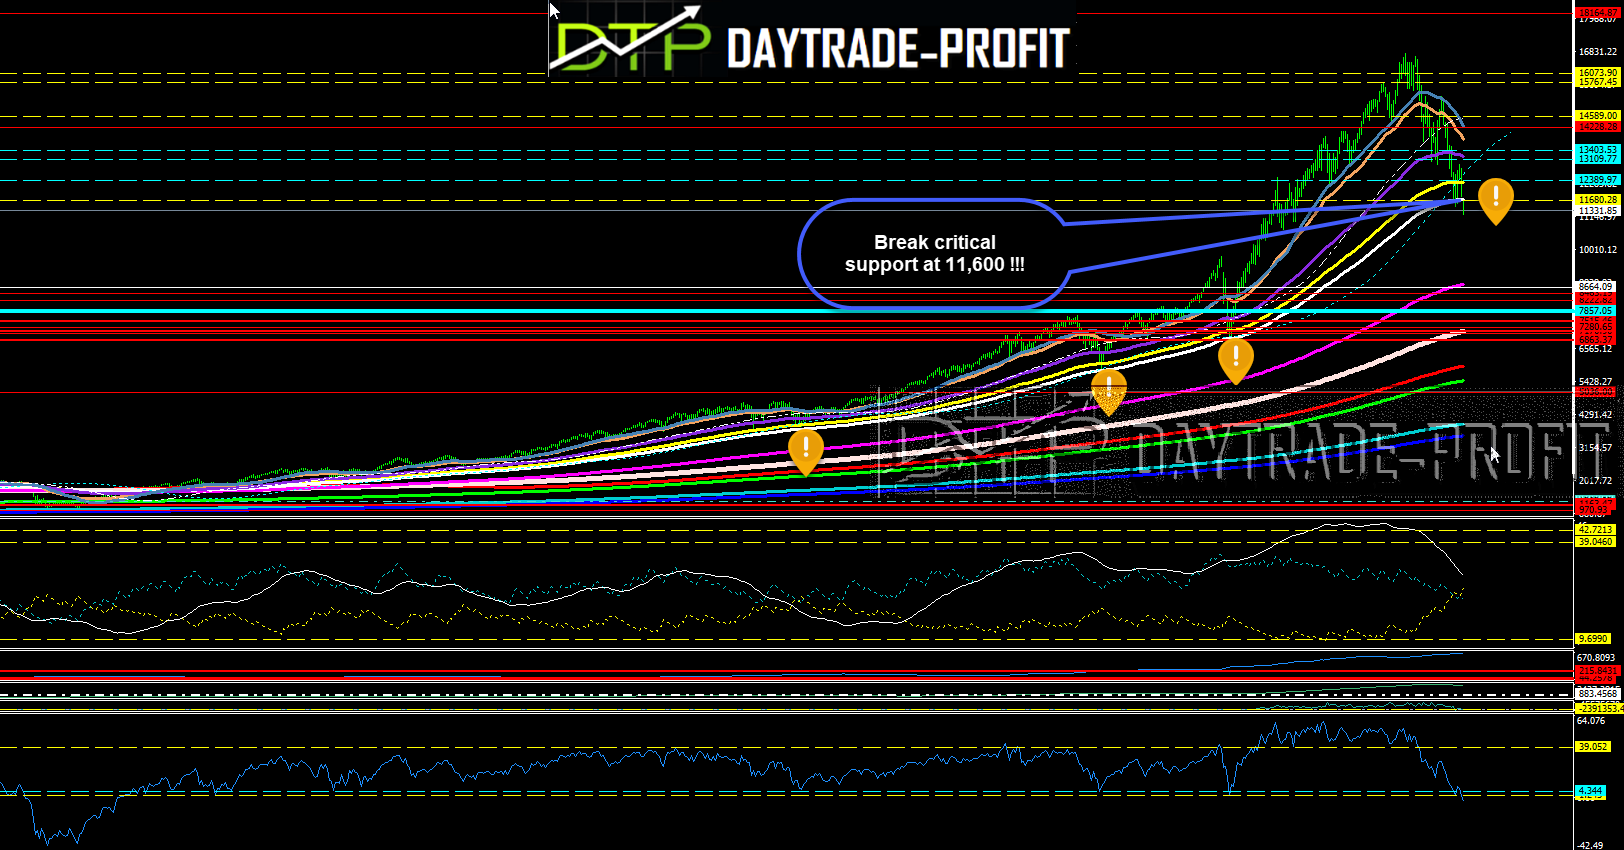
If we are facing a bear market rally I expect to see at least 12500- There may be a bouncy way to achieve these goals and even break the lows
But in the big picture, as long as the index does not break the 10890 area on a daily basis then everything is open
LAST POST ON 30.2.2022 must be read
also please look at the others to get some perspective
An unusual year started how will it end?
Are there any signs of the coming future for stock markets in 2022?
is it the time to be or not to be in the markets

NASDAQ:
For the future to come as I said in the last post
Need to see what is happening in the areas of 12800-13100 is critical
If the levels of area 13200-13300 are broken on a daily basis, then the target of area 14200-14500 is on the horizon.
correction at this stage to areas 11680 12030 _ is quite likely for those who looking for a reconnection to extended trade To the levels I mentioned above, Alternatively, a decline from area 10890 downwards will signal continued weakness in the market: In the first stage to area 10500 + _ then area 9200 + _

The resemblance to 2001

This review does not include any document and/or file attached to it as an advice or recommendation to buy/sell securities and/or other advice

