MARKETS TECHNICAL ANALYSIS NEWS
The demon came out from the bottle and Financial markets bleeding
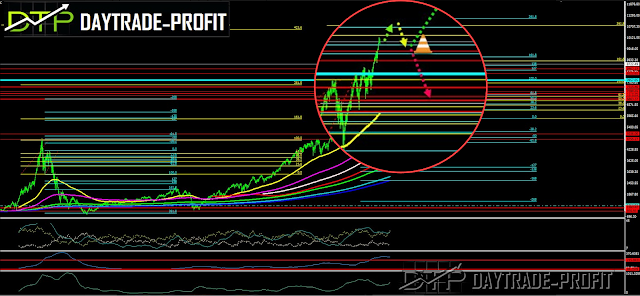
When there is a Bubble / Extreme situation like now then you should go and see what was in the past According to my indicator, we are now entered to extreme market
 |
| markets forecast |
Let’s see how things connect
Look at something beautiful, I did not touch
At the beginning of the year, before all the crazy moves we are now seeing in the markets, I posted a market review for 2020 and listed a few things to anyone who would like to read everything listed here above
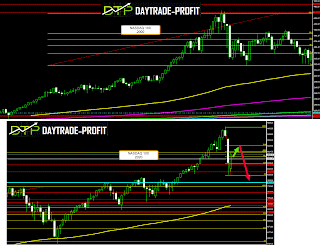
look at the year 2000 also – this could also happen if the markets will enter to bear market
 |
| markets news |
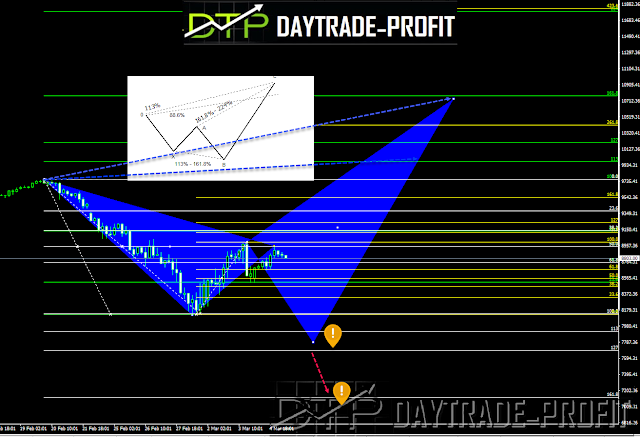
The interesting point is that a pattern continues now as a mirror image according to the graph
If and when, the high correction levels, which we saw two days ago on 3.3.2020, will not be pushed up again, we have here a beautiful case of a complementary pattern on the graph
What do I mean:
Harmonic Pattern SHARK Template
This pattern frequently defines excellent opportunities but these reversals are often sharp and require specific management strategies
its accurate and aggressive reactions typically possess over-extended price action that can be successfully traded as long as a more active management risk is working.
The Shark pattern has the following conditions.
• AB leg extends OX leg between 113% – 161.8%
• BC leg extends beyond O by 113% of the OX leg
• BC leg is also an extension of AX by 161.8% – 224%
We will focus on NASDAQ for that matter
This template should give us a drop target of between 7000 and 7900 points, as it will take place
If it was, and the declines would go down to around 7,000 points, which is a critical point that marks a bear market, and will stop there of course, then the pattern is being asked that the market be repaired to a new high of 10,800 points.
The drop levels created by the pattern, below the previous low created at the end of February on February 28, 2020, can be the following steps:
7800-7900 points
7600 points
The latter is the most critical area 7000 points
 |
| markets pattern |
If this is indeed the picture then it would be nice to see the sequel accordingly
 |
| USD JPY ANALYSIS |
This review does not include any document and/or file attached to it as an advice or recommendation to buy/sell securities and/or other advice
www.daytrade-profit.com

