FOREX MARKET TECHNICAL ANALYSIS FORECAST
Forex market Step Forward Two Back Scubido”
Dollar Index broke above the key 90.00 level, the biggest spike since Dec 2016 – to its highest level since mid-January. With net speculative positioning at extreme shorts
Some of the pairs in the forex market are facing critical junction points for a further move against the dollar in the world.
I will try to give a broad overview of some of them, following the previous post,
And will focus this time on the big picture of the trend in the foreign exchange market,
There are several pairs that have been shuffling for a very long time, and where a direction reading for a move, breakout or breakout will signal a big move and a clearer move, while the others are in a clearer and more visible trend, such as the Euro and the Yen where the limits of the big move are not far from a change of trend. A long-term move is not short
 |
| forex position |
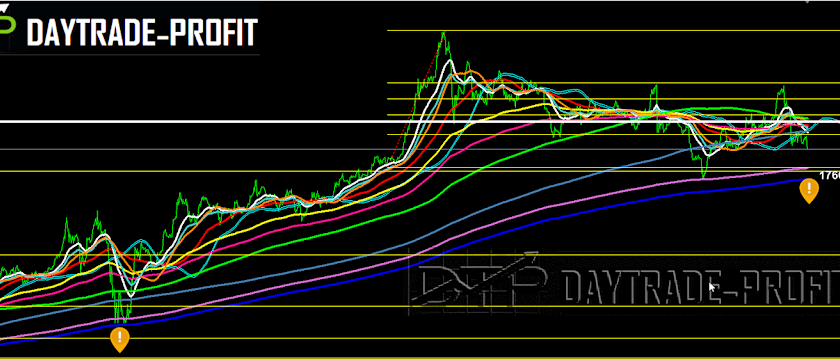
EUR/USD technical analysis
Failed to take out 1.2560 resistance and retreated, break up again on daily basis 1.2560 price level will confirm medium term rally resumption and target next key Fibonacci level at 1.2860
However, sustained price below will extend the consolidation pattern from 1.2091 key support with another decline through 1.1760 support.
It’s still early to decide whether price action form 1.0339 is developing into a corrective or impulsive pattern, in the bigger picture this is still seen as a corrective move for the moment.
Euro-Dollar pair produce the same move and pattern that were in the past
GBP/USD technical analysis
Long-term chart is showing to us that As long as GBP USD will stay above 1.360+_ Key support the trend is up, the medium-term outlook in GBP USD will remain bullish as long Short term charts show us that as long GBP USD will stay above 1.3600+_ the trend is up
Told you last week that there is a strange situation on this pair with position map
Short-term support stays in 1.3890, resistance in 1.4020, above this, the price GBP USD could test upper levels at 1.4560-1.4620 price area while crossing those prices will send GBP USD to the 1.4920+_ price area with Further targets that could hit the top at 1.55 price area!
Look yellow strip on the charts (since his top at 2.11 at 2007 the journey is followed by correction moves who’s triggered by this yellow strip two times before at 2009 and 2014 ‘ will it stop again in this point? or the journey up finished?
Below 1.3300 price area, it could bring larger down trend resumption, while we have first to meet 1.3080. On the downside, break of 1.2840 support will indicate short-term topping. If it will fail to stay above the level, it will be turned back to the downside for 1.2640 support current
Meanwhile, GBP/USD remains mildly on the upside.
USD/JPY technical analysis
The trend is still bearish as long as USD JPY stay below 109.70+_ resistance. Considering bullish convergence condition only decisive if there will be break adobe 109.70 it will indicate term reversal. In such case, outlook will be turned bullish. But on the other hand, Break down again lows of 106.40 will confirm more lows to the 100.70+_ target price, minor resistance stay in 108.30 price area.
Minor support area stay in 106.40 -107.30 / Minor resistance area stay in 108.10-108.30
See this post at the bottom of the USD/JPY is still far away
USD/TRY technical analysis
Long-term trend forecast moved is still up as long as 3.67 will hold!
Break below 3.67 on weekly basis will send the Turkish to 3.49 and after to test 3.24 -upper limits for this round on my opinion is limited to 4.18-4.22
 |
| FOREX ANALYSIS |
This review does not including any document and/or file attached to it as an advice or recommendation to buy/sell securities and/or other advice


