

Stock Markets Technical Analysis
Last month I posted this :
Will seasonal Volatility in September return again this year?
Also in September …. If we look at things, we can now expect two scenarios:
Volatility September return again this year- part 2
Now let’s look again for examining more details
The statistics do not lie, and this time too we get markets volatility
It was not surprising in this case – the charts show us that we should expect corrections…..
Now markets examining the oscillators who marked the change in trend during the pandemic period
The indices are within walking distance before examining critical test levels
Breaking down those levels will mark a profound correction and a change of trend
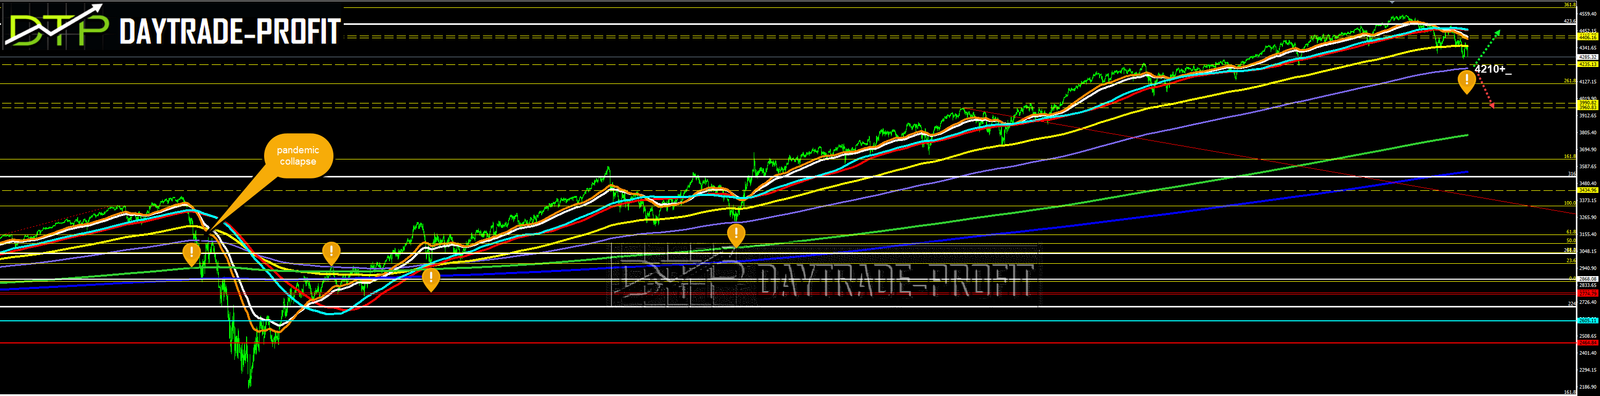
For example, S&P 500 Breaking Down will take out a target area of 3800 points On the other hand, support can give a nice setup for re-entry on test levels
*At the moment in terms of other factors in the market, I do not see any panic, as for now*
Test point for the S&P 500 – 4210 +_ points

S&P 500 Analysis
Test point for the Nasdaq – 14,100 +_ points

Nasdaq Analysis
Critical economic data for the rest of the month

This review does not include any document and/or file attached to it as advice or recommendation to buy/sell securities and/or other advice