

Amazon Stock Analysis
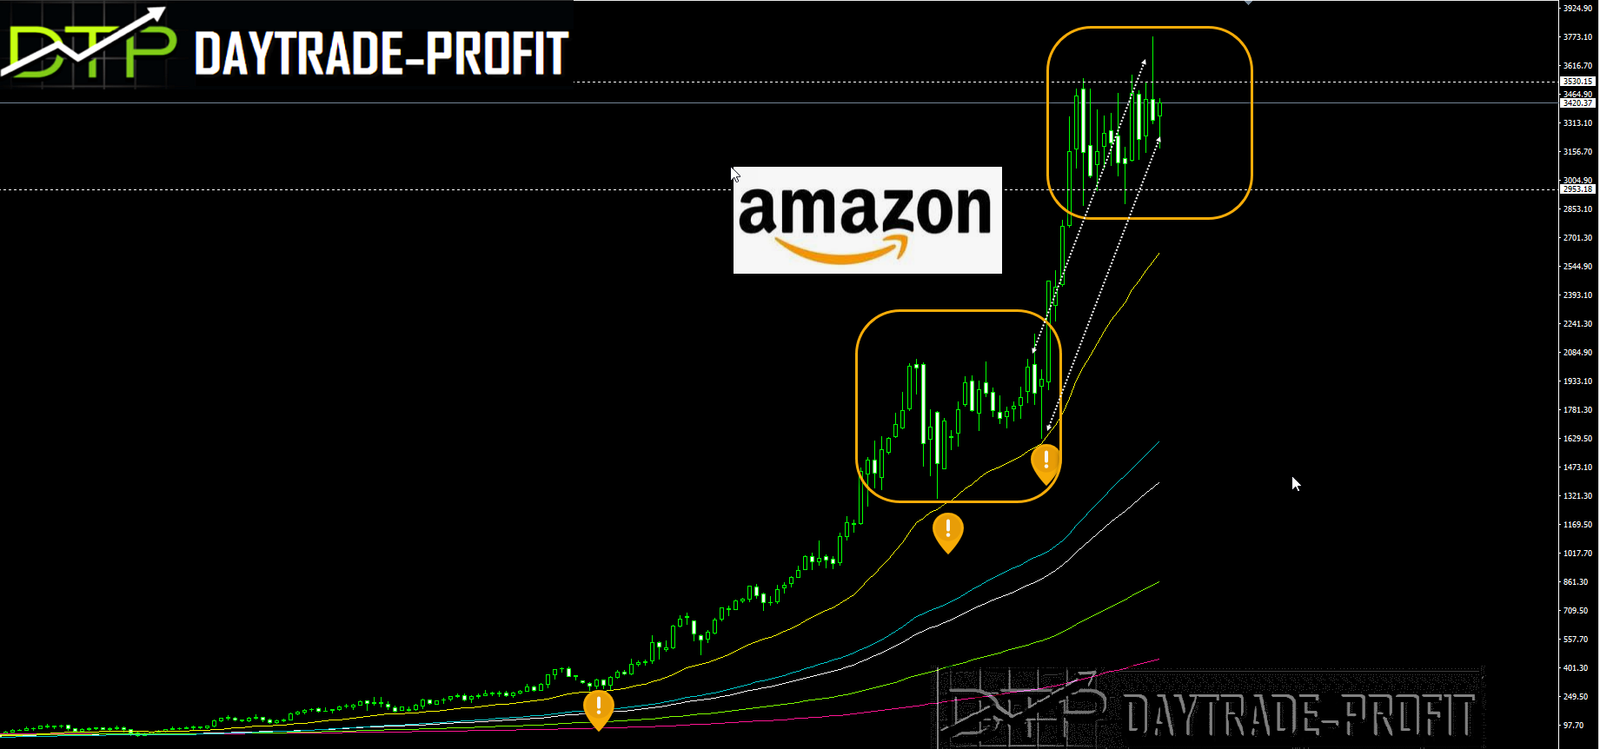
Amazon stock – do we have a replay here, and the stock is on its way to conquering new records? Targets this simulation will lead amazon to 4120 area and maybe even to 4600$
You can see that in 2020, we also had a pattern of a long shuffle, with a simulated break, and the creation of a gap below, when in March, the stock set a bottom and went out again to the breakout area, and in April increased to do and broke to new highs, Will we see the same move now?
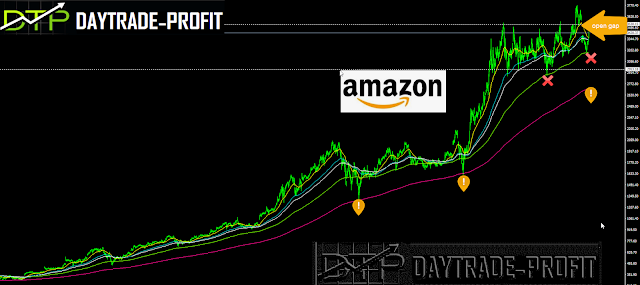
First, we have a few things to close:
1. Open gap
2. Convincing breakout area 3780
If and assuming these conditions are accepted, then one should expect to see the areas of 4120 and possibly even 4600

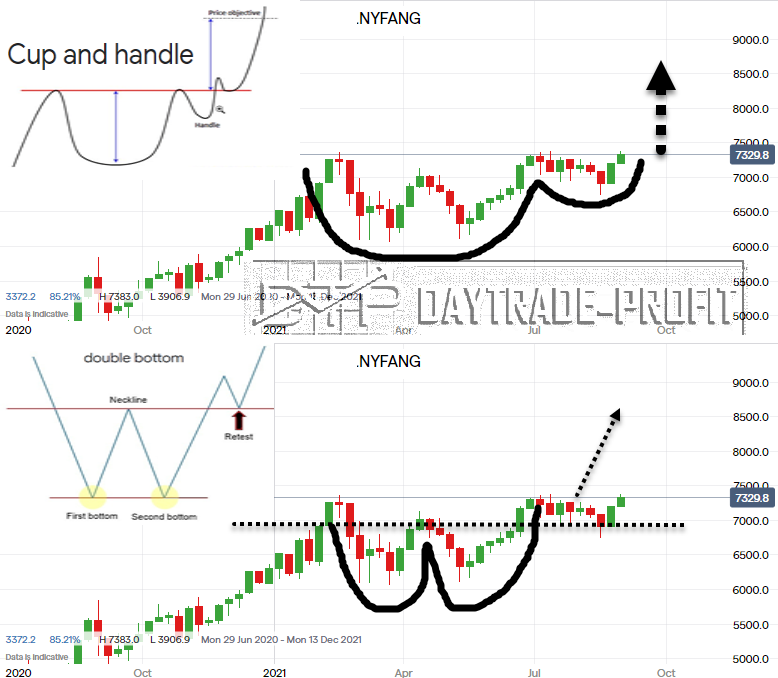
Another thing that is worth checking out is the Fang Index (is an index that provides exposure to 10 highly-traded tech giants – amazon is one of them)
There you can see 2 technical templates that are emerging
Cup and handle Harmonic pattern
W Harmonic pattern
This review does not include any document and/or file attached to it as advice or recommendation to buy/sell securities and/or other advice