GOLD PRICE TECHNICAL ANALYSIS
Investors are dumping gold in favor of Bitcoin, its look like cryptocurrencies has stolen a large market share of gold generallywhen bond rates go down, gold goes up. However, in recent weeks, the yields on bonds have decreased, and gold has simultaneously dropped by two percent – an event that is quite rare.
Analysts think the change is the result of increased investments in Bitcoin, among other cryptocurrencies.
see my last post: Will the Gold price go 1400$ Or 1100$ Following Last majors events in the world?
Gold steadied below $1,250 an ounce on Monday after its biggest weekly drop in more than six months, with moves muted ahead of an expected interest rate hike from the US Federal Reserve this week.
The Fed is widely tipped to lift rates at its two-day policy meeting ending Wednesday, but its accompanying statement will be closely watched for any surprises.
The bank is expected to increase rates another two or three times in 2018, but still-sluggish inflation and wage growth have raised question marks over that view.
Though we expect few major changes to Fed policy until new Fed Chair Powell takes office-Gold is highly sensitive to rising US interest rates, as these increase the opportunity cost of holding non-yielding bullion, while boosting the dollar, in which it is priced.
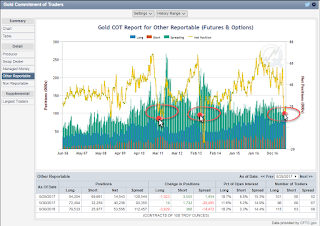
In the wider markets, world stocks rose and equity volatility neared a record low ahead of a raft of central bank rate decisions, while newly launched bitcoin futures shot above $18,000. Hedge funds and money managers sharply reduced their net long positions in COMEX gold and silver contracts in the week to December 5, US data showed on Friday. Net positions in silver fell by the largest amount on record
In addition, there is the price band is imprisoned between 1170 and 1370
Strong support: 1224-1233 price areas are meaningful numbers, my strategy will be for more downtrend to 1181$ +_
 |
| GOLD ANALYSIS |
 |
| GOLD POSITION |
This review does not including any document and / or file attached to it as an advice or recommendation to buy / sell securities and / or other advice


