

XAG/USD (Silver) Technical Review: Bearish ABCD + Bearish Cypher Two Scenarios
This daily technical review maps two high-structure harmonic setups currently visible on the charts:
Bearish ABCD
Bearish Cypher harmonic with a clearly defined PRZ (Potential Reversal Zone)
Quick Scenario Map (Daily)
Scenario 1 — Bearish continuation confirms
Price fails at resistance/PRZ, prints rejection, and the daily structure remains bearish.
Scenario 2 — Bearish thesis invalidates (pattern breaks)
Price holds above invalidation on daily closes.
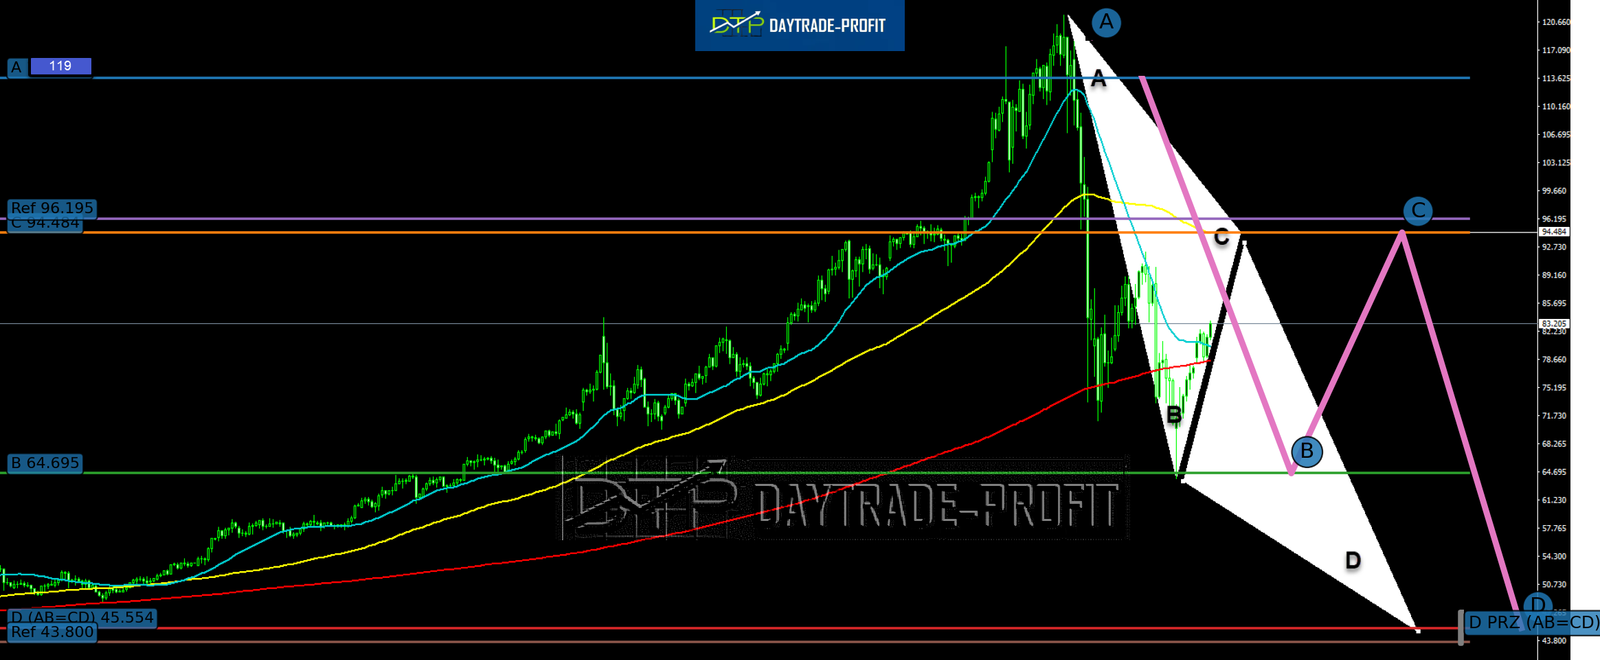
Chart 1 — Bearish ABCD (Measured Move: A–B–C–D)
In the classic AB=CD version, the market “projects” the AB distance from point C to estimate a completion zone at D. The key idea is simple: completion zones are decision areas, not guarantees.

Use these levels as your “line in the sand” structure:
A: 119-121
B: 64.-65
C: 94-96
Invalidation buffer: 96.195 (above C)
D (AB=CD target): 43-45
Structure reference: 44 (nearby historical support reference)
*Invalidation (What proves wrong)
Sustained acceptance above 96.195 (buffer above C) — not just intraday spikes
If daily closes hold above that buffer, the ABCD continuation thesis is no longer the clean read.
Targets (Realistic staging)
Stage downside objectives rather than aiming for a single “home run”:
Target 1: B = 64.695 (prior low retest / first major magnet)
Target 2: D = 45.554 (AB=CD completion / macro target zone)
Optional reference: 43.800 (structure/support reference area)
Chart 2 — Bearish Cypher (X–A–B–C–D, PRZ at 0.786 of XC)
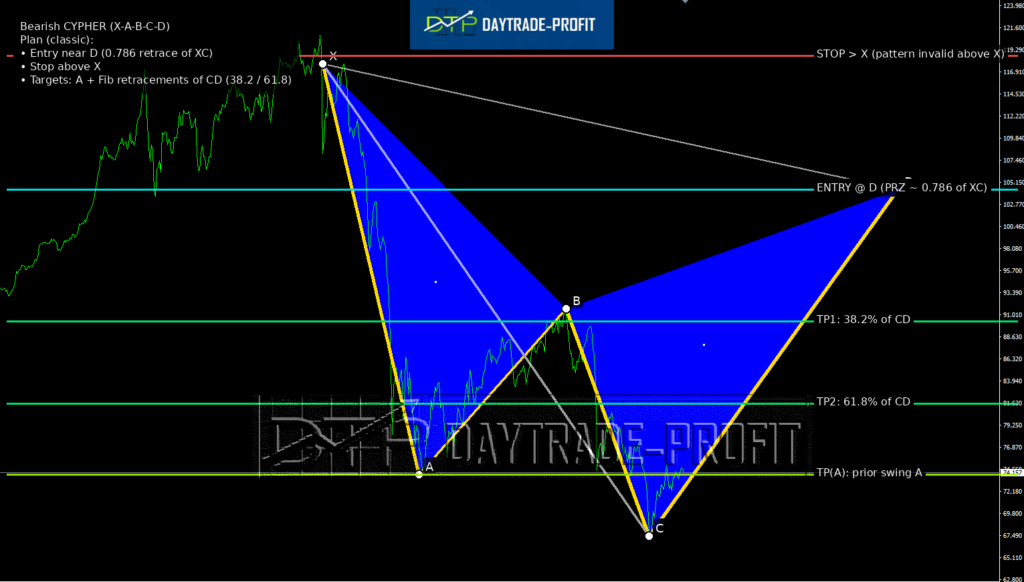
In Cypher, the most important concept is the PRZ—where the pattern completes and becomes actionable upon confirmation.
A common Cypher framing:
The setup culminates at D, typically near the 0.786 retracement of XC
The PRZ is a location, not a signal
Your Cypher Levels (From Your Chart)
These levels are already structured well for an execution ladder:
X (Stop/invalidation reference): 119.29 (pattern invalid above X)
D PRZ / entry zone: 105.15 (0.786 of XC)
TP1: 91.010 (38.2% retracement of CD)
TP2: 81.620 (61.8% retracement of CD)
TP(A): 74.157 (prior swing A)
Targets (Staged exits)
Your ladder is already clean:
TP1: 91.010
TP2: 81.620
Stretch/structure target: 74.157 (prior swing A)
How These Two Patterns Work Together (Clean Confluence)
Think of this as two layers:
Layer 1: Cypher = near-term sell zone + first downside ladder
If price reaches 105.15 and rejects, the Cypher provides:
clean invalidation (119.29)
defined downside objectives (91 → 81.62 → 74.16)
Layer 2: ABCD = macro roadmap if bearish structure persists
If rebounds keep failing and the broader structure stays heavy, ABCD provides:
C resistance zone (94.484)
first magnet (64.695)
macro completion zone (45.554, with 43.800 as a nearby reference)