Markets Analysis
The S&P 500 broke down major support during the trading session last week, there are a lot of concerns when it comes to the global growth story and of course, the US/China trade situation, which doesn’t seem to be getting better. even more fuel to the selling pressure is the fact that Donald Trump has just suggested that the Mexicans( On June 10, customs duties will be imposed at 5% and will grow by an additional 5% in each of the following months, reaching 25% in October) and others countries are next targets.
The risk that the global trade war poses to the global economy lies in economic growth, which will be adversely affected by rising costs, a slowdown in consumer demand, and a reduction in capital expenditures by the companies
Add to that when interest rates are low, central banks can not use their standard tools to stimulate the economy – lowering interest rates
And get a recipe for tomato salad
You can also see this time, the correlation that exists between the indices and the dollar yen
 |
| Markets Analysis |
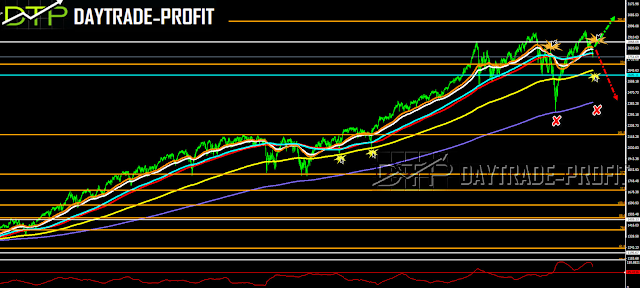
Technically view on the SP 500 index:
1. Last week’s volume was the highest since last December!
2. short term trend becomes bearish as long 2863+_ points will not break up again the trend will become positive,While as long the SP 500 continue to trade below 2805 +_ points – we should expect for more lows level: 2710 /2640 and even 2400 points
3. Do not disqualify a correction up in the index again to the 2800 area if not more, but the business now looks much more negative than positive!
4. The big trend is still up as long 2400+_ points will hold
 |
| SP 500 index |
Facebook has released reports yesterday and costs over 11% – comes to check the Gap, the refractive levels of the rising move: if it closes above the $ 171 area, we have a set up here to catch a move to close the top – it’s worth watching closely!
Amazon, as I have mentioned several times, should cross the 1760 area in order to show a continuing upward trend! If the conditions that I have mentioned exist, expect another incremental move
If not then the story is different:
This review does not include any document and/or file attached to it as advice or recommendation to buy/sell securities and/or other advice

