

Markets Technical Analysis
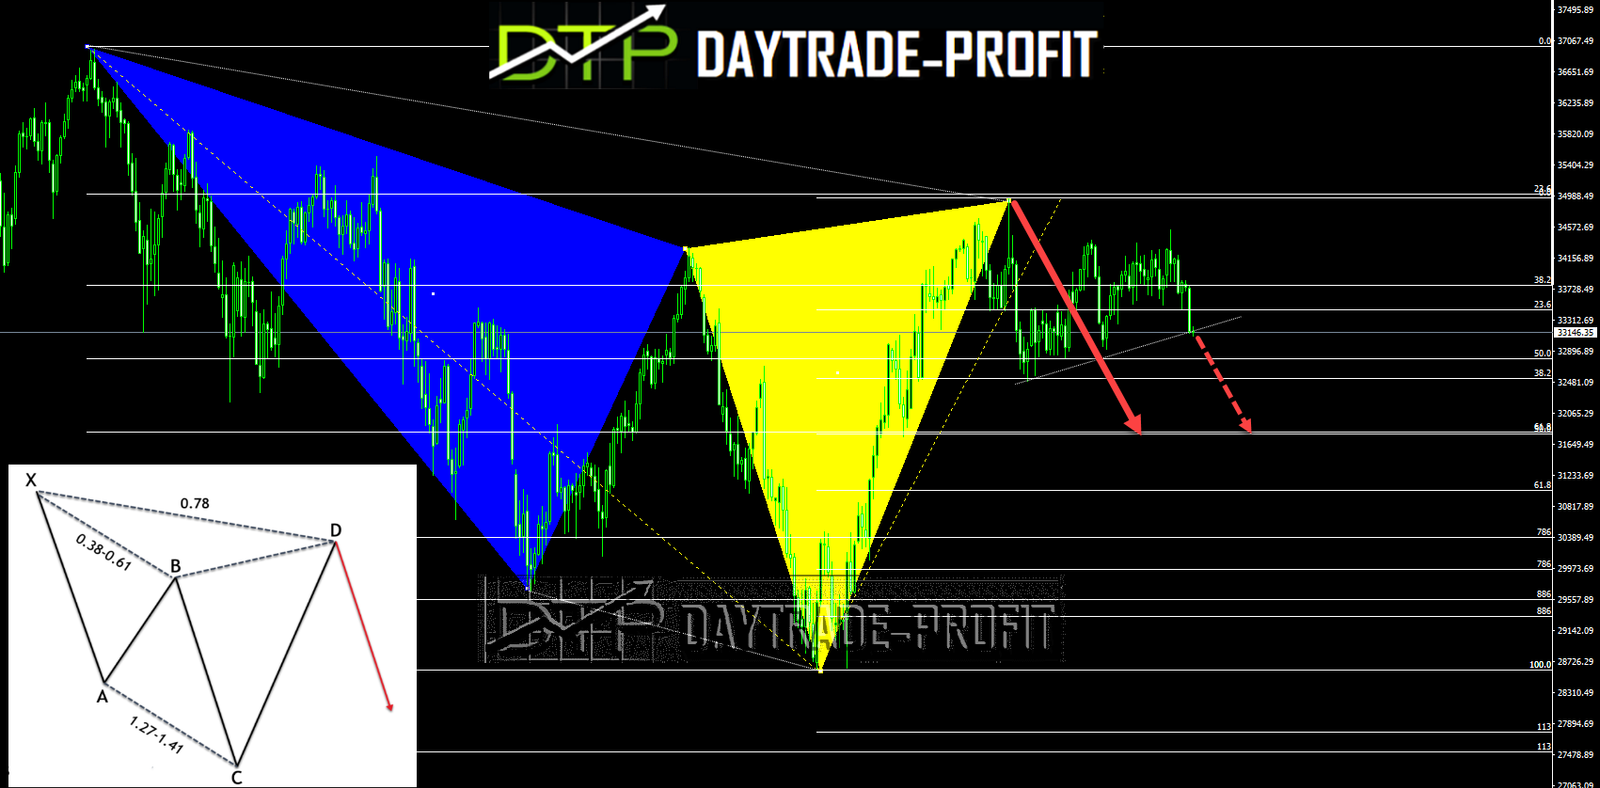
If we look carefully at the Dow Jones index then we can identify a harmonic pattern: Bearish Cypher pattern
Before I explain the essence of the template, trading goals, etc.
Keep those numbers in front of your eyes:
A daily Break below 33100 points will confirm more downtrend correction to the 31800-32100+- point area while staying above it will suggest support for buying with a tight stop

Dow Jones analysis
A bearish Cypher pattern is a type of technical analysis chart pattern that can indicate a potential bearish trend reversal. It is formed by a series of price swings and Fibonacci retracements. Here are the key characteristics of a bearish Cypher pattern:
Initial move: The pattern starts with a bearish trend.
Corrective move: The price moves up in a corrective wave, retracing a portion of the initial move.
Impulsive move: The price then moves down in a strong bearish move, surpassing the initial low.
Final move: The price corrects higher in another corrective wave, but fails to exceed the previous high.
The bearish Cypher pattern is complete when the price reaches the point where the impulsive move began. This level is referred to as “point D,” and is often identified as a potential resistance level.
to identify potential price targets for the upcoming downtrend: The key Fibonacci retracement levels to watch for are 38.2%, 61.8%, and 100% of the initial move (X to A).
Some traders use a conservative approach and set their initial price target at the 38.2% retracement level. This level is typically considered a minor support level, and the price may encounter some resistance at this level before continuing lower.
other traders may use a more aggressive approach and set their initial price target at the 61.8% retracement level. This level is typically considered a major support level, and the price may encounter significant support at this level before continuing lower.¨C8CIf the price continues to move lower, the 100% retracement level is the final target for the pattern. This level represents a complete reversal of the initial move, and the price may encounter strong support at this level.
¨This review does not include any document and/or file attached to it as advice or recommendation to buy/sell securities and/or other advice