stock market analysis
I could not believe the markets would make such an impressive recovery in such a short time but we need to look ahead and see what is right for us to do now, in one post this year I mention this option, this was on the lines: Look at the year 2001 = April and make the receipt in the reverse graph
The huge upside price rally in the US stock market in Friday pushed the stock market higher especially the NASDAQ run-up to new all-time highs
In my opinion, this incredible rally in the stock market may become a speculator “bubble” it’s no secret the current economic data does not support a US stock market rallying to new all-time highs
It is an election year, and the reality is that Trump is a sworn capitalist who will do anything to show that the stock exchanges are up and the situation is good
Ignoring all risks and other data. Traders have no fear of any downside risks. We have seen this before and it usually ends badly ….. just before it all fell apart.
The real economic reality on the ground does not support these increases
US UNEMPLOYMENT RATE
US ISM NON-MANUFACTURING BUSINESS
US UNEMPLOYMENT RATE
Earning reports………. till that time in July there is no real impact for those results so basically, the road looks safe for pumping prices higher
This type of r activity is reminiscent of 2005 to 2007 where the stock market rallied eventually leading to a breakdown in the stock market in 2008-09 and a much deeper breakdown
or for my view more like 2000-2002 breakdown in the stock market by the other hand From the price movement and I’ve already talked about it, in that time the stock market deeper by 5 waves when in the middle we saw 2 recovers by 50 % and 333% and after that, the story changed
see the similarity to 1998 in the sp 500 :
 |
| sp 500 chart analysis |
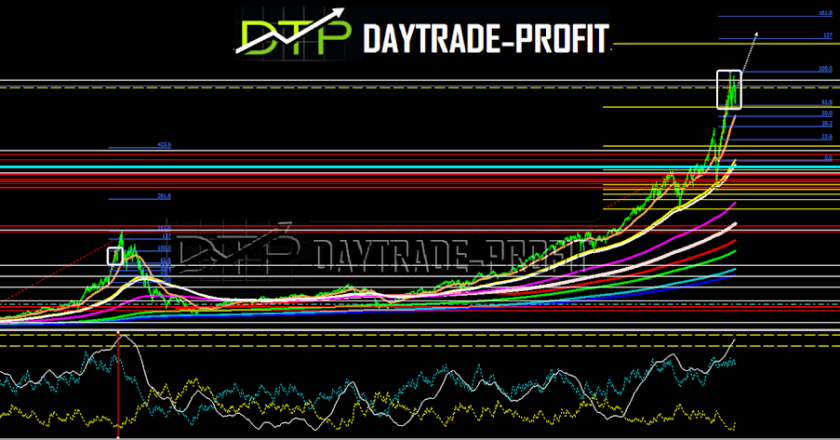
I think that now we are entering one of the 2 scenarios in the Nasdaq index :
1. In 2001, the market (Nasdaq) was in the midst of a strong downward move, when in January it recovered rapidly by 35%, from 2000 pts to 2700 pts and returned to lower prices to 1360.
The parallel to the current move is 9700 and from there to 6600 decreases 32%
And today is above the record level – if that is the case, then I expect we will see Nasdaq run at the 10500-10900 point, come back to check the breakout level, and there if it holds, then we will continue to a new record of 13800-14900, with the middle level also in 11600 points and 12100 points
2. In 2001, the market (Nasdaq) was in the midst of a strong downward move, when in April it recovered 48% from 1350 pts to 2000 pts and returned to lower prices to 1000
Also in September 2001 until January 2002 it is happening
Parallel to the current move 9700 and from there to 6600 down 32%
In addition, today is above the record level – if that is the case, then I expect we’ll see the Nasdaq run toward the 10500 -10900 point level, and where the journey south begins.
In any case, it is a matter of a year or a few months that we will see something big here, that is not seen in the markets
 |
| markets analysis |
My oscillators show me more resemblance to the April 2001 case
Bubble trading is violent and rewarding if handled properly
This review does not include any document and/or file attached to it as an advice or recommendation to buy/sell securities and/or other advice
www.daytrade-profit.com


3 Comments
Lady S
The something big is up or down?
Lady S
It arrived almost 10900, now you think we are going to see less than 6600?
DAYTRADEPROFIT
next target above stand on 13,500+_+