

Markets Technical Analysis
At the beginning of the year, I covered a post about the markets: “are markets going up to get amnesty, or its a trend change?”
now we are fighting -Will the long-awaited breakthrough come or will we be in for another kind of surprise? Tricky mode situation
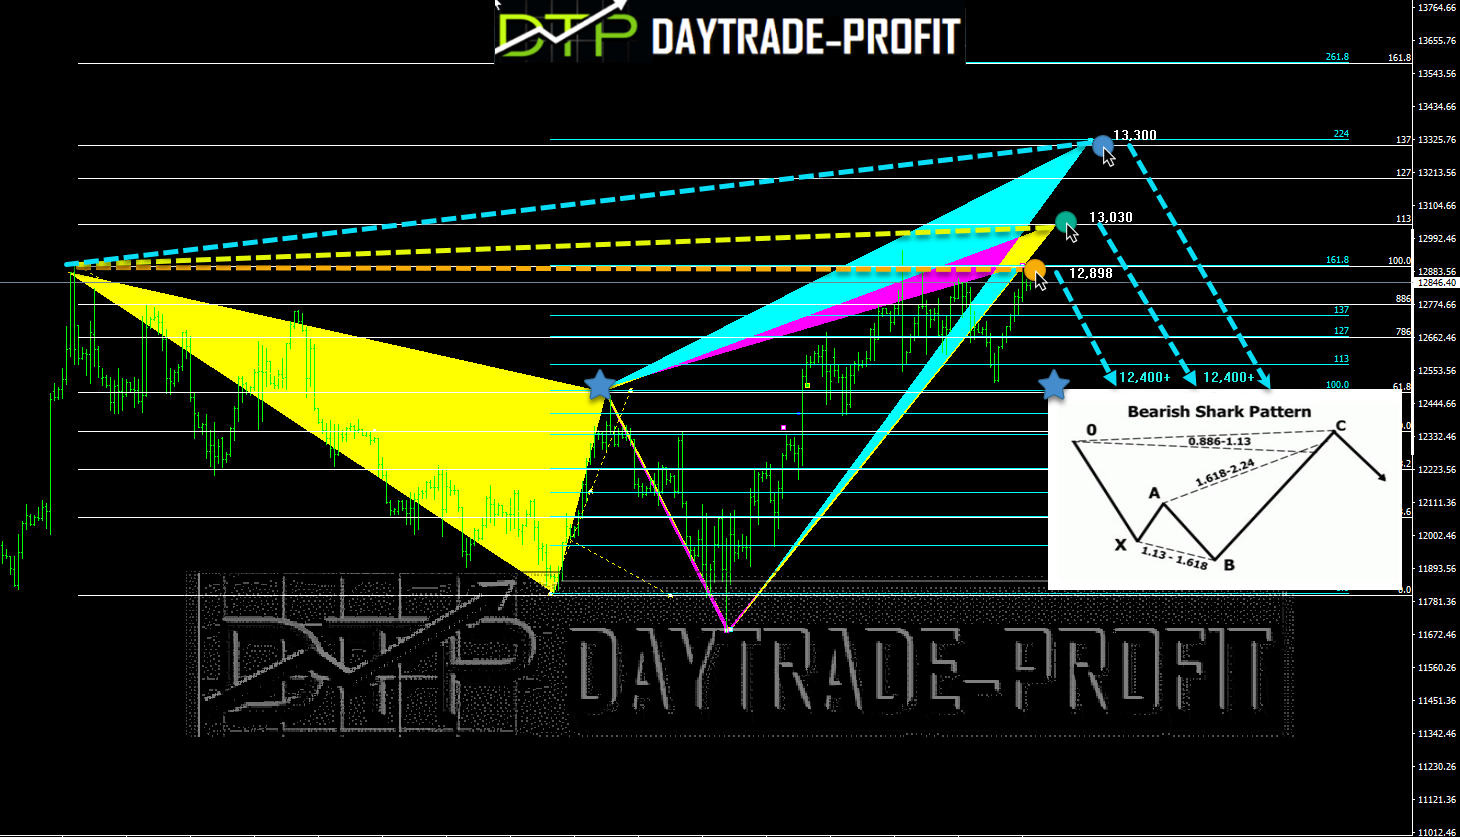
Regarding support and resistance levels, the NASDAQ has established several key levels over the past few months. One notable support level is around the 11,600 level, which has held up as support multiple times since the market bottomed out in Sep 2022, An intermediate level rests on the 12300-12400 zone
The NASDAQ has established several key resistance levels, with the most notable resistance level currently around the 12800 level.

I noticed that we may have a harmonic pattern emerging here
Bearish shark pattern is a technical chart pattern typically characterized by the following features:
An initial price swing (XA) that is bearish and significant in size.
A retracement (AB) typically between 38.2% and 61.8% of the XA leg.
A rally (BC) is typically 113% to 161.8% of the AB leg.
A second retracement (CD) typically retraces 61.8% of the BC leg.
A final rally (DE) that fails to exceed the high of the BC leg.
The pattern is considered bearish because it suggests that the price is likely to decline following the completion of the pattern. Traders may look for short-selling opportunities when the price reaches the completion point of the pattern, which is typically at the D point.
The profit target for the bearish shark pattern is typically at the 61.8% Fibonacci retracement level of the BC leg.

This review does not include any document and/or file attached to it as advice or recommendation to buy/sell securities and/or other advice