

Gold Chart Technical Analysis
For a long time, I did not write a review on goldThe truth is that there was not much to register, but now it seems that we intend to start volatility in the propertyGold has tended to trade on a fairly narrow trend recently, having suffered declines from the last peak area in August last year can be seen that there are buds of support in the area of the last lowlands in the area of 1670Opposition in the area 1764
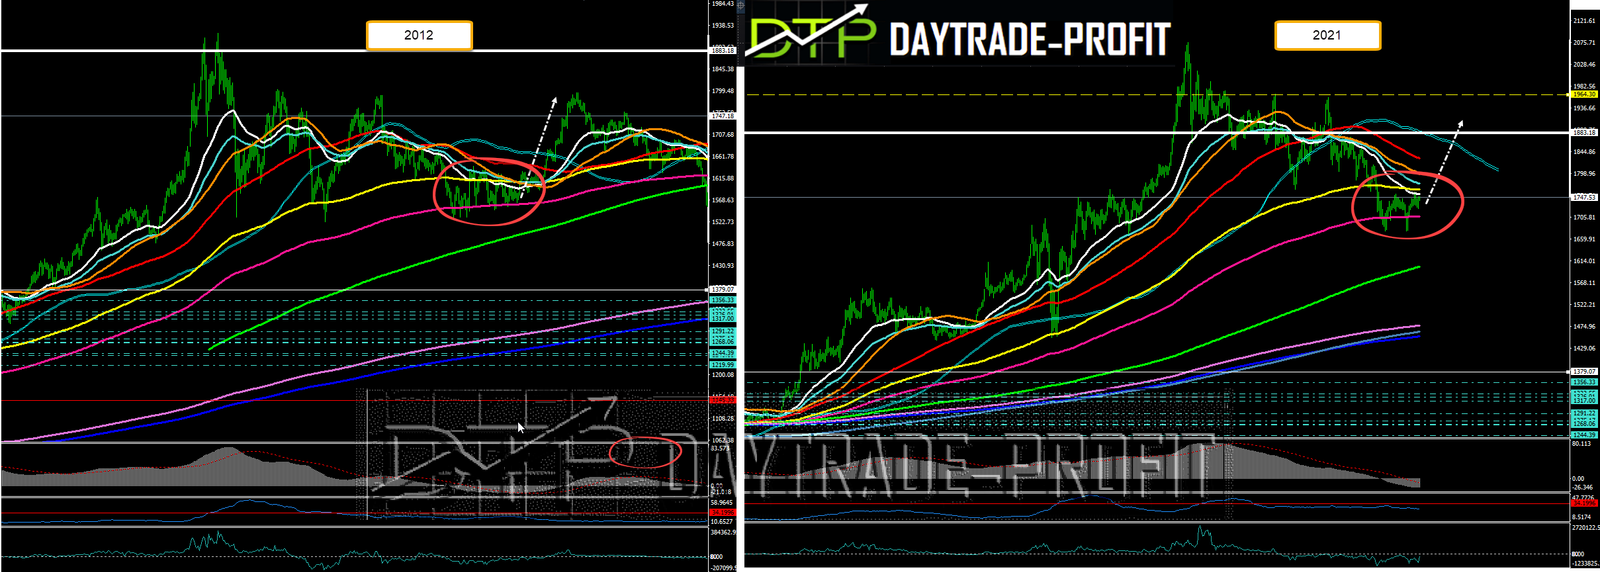
I went to check out some probability scenarios to predict continued movement in goldThere’s something that caught my eye – and that’s what happened in 2012Technically and the set up of the straps (cuts and movement) it looks really similar indeed the continuation will be the same then expect to see in the property again the 1880 area and if this area will then break through the 1960 areas will not be easy and it seems likely that we will see the lowlands of 1703 againBut by and large, the picture is starting to show us that there is probably an upward movement of prices here

Bullish Scenariomove over $1776 will indicate the presence of buyers, this will indicate that gold moves get the potential trigger point for an acceleration into 1823$ 1880$ 1960$ levels
Bearish Scenario move under $1726 could create the downside momentum needed to challenge $1703, followed closely by $1703 could trigger an acceleration to the downside with the next target the main bottom at $1670 and even more
The important levels for looking at and examining the property are in a number of areas in my opinion, they should be followed1677 1703 1726 1776 1823 1880 1960
You’ll probably see more choppy moves in gold until this move will go out

This review does not include any document and/or file attached to it as advice or recommendation to buy/sell securities and/or other advice