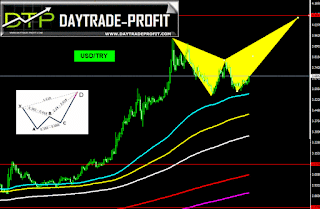
Turkish lira Price Technical Analysis Forecast update
Long time no speak about usdtry – it’s about time to take look on this pair, let’s test and review the Turkish lira momentum
From my last post, I wrote couple scenarios
The first option – breaking area of 3.82-3.86 will lead the usd try to cope with + 4.10
Option Two: Amendment to the 3.55 to 3.59 area and from there back to the peak, with the possibility of hacking the last high
A third option: correction down to 3.50 + _ and then re-examine the usd try pair again
So we get the third one
and is also an extension of 224% – 316% of the AB leg
 |
| Turkish lira forecast |
 |
| USD/TRY |
Technical analysis long term
look closely, you can see the strong support at 3.49+_ , break down this level May cause usdtry breakdown mode and change the trend direction in the Turkish lira
 |
| Turkish lira technical analysis |
this post dedicate to all my Turkish client who read this blog and I know there are many from turkey and off course to all my readers
This review does not including any document and/or file attached to it as an advice or recommendation to buy/sell securities and/or other advice

