Bitcoin price analysis
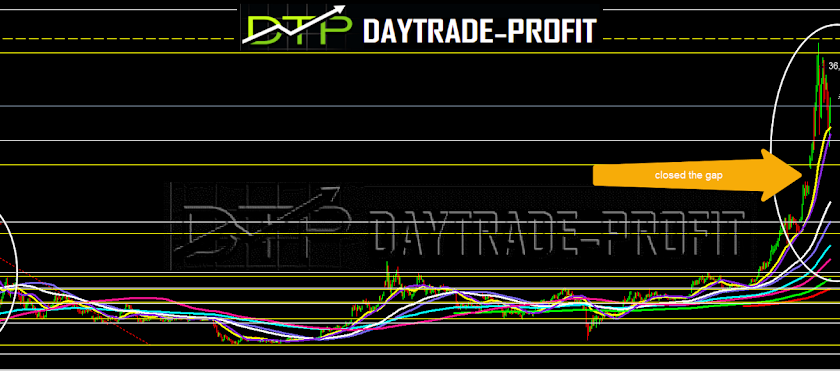
The last post on Bitcoin was
” Is bitcoin on its way to closing old gaps”?
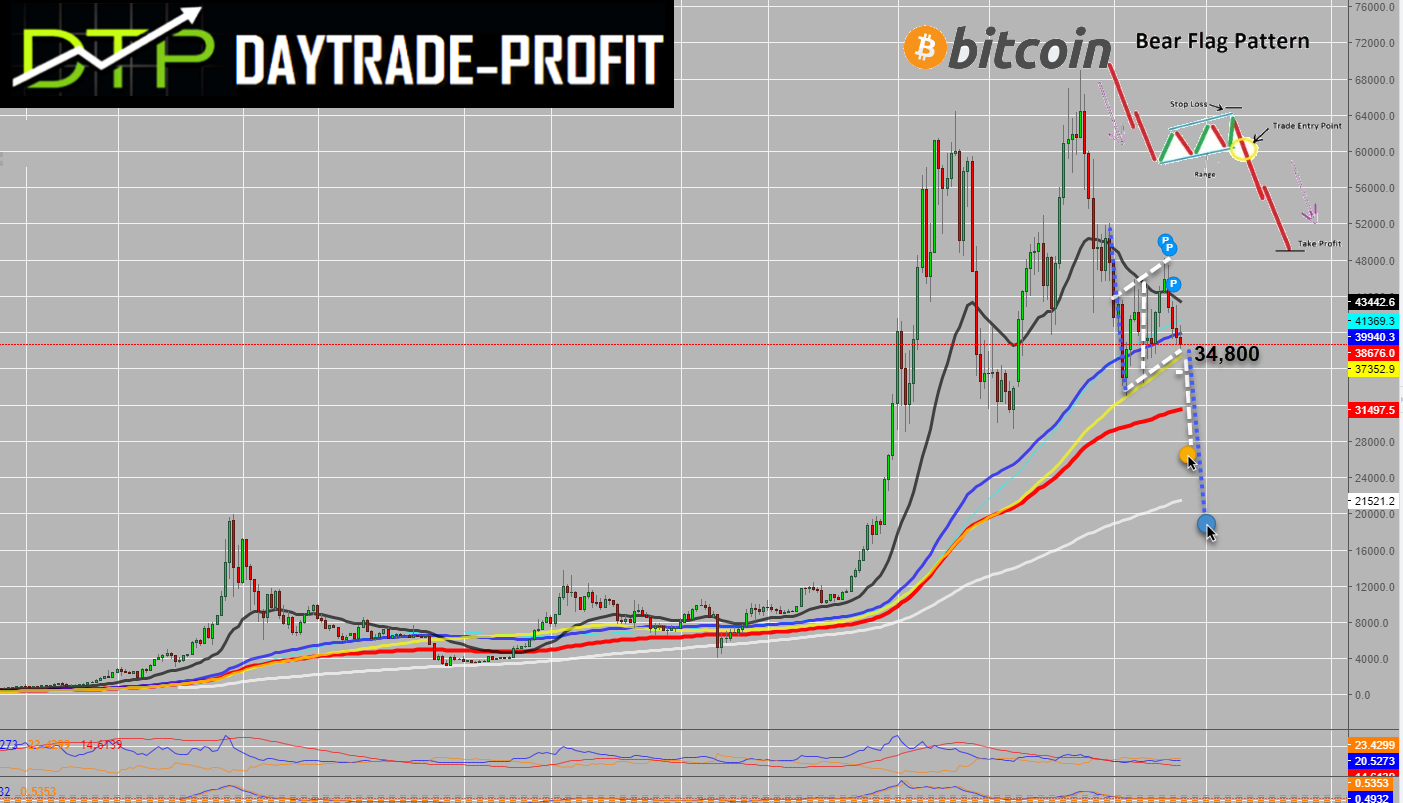
in addition to what I was writing – there is another pattern that you can see clearly: the Bear flag pattern
p/s
To get formation approved we need to see bitcoin drop below 34,800$
The Bear flag pattern develops in a bearish trend or when a bearish trend is about to be formed and when sellers/bears are in control.
A bearish flag is characterized by a sharp drop in price followed by a period of gradual price congestion moving higher within a channel.
After the market makes a strong down move, it enters into consolidation -On break out of the bearish flag, the price then travels a minimum distance from the flag
Technical analysis
Resistance level- 41000, 45000
Support level- 37000, 34800 -35800 ,33000, 28000, 24000, 21000,
Open gap at 24000 $ price area

There is a trading pattern that caught my eye: Cypher Pattern
We can see that the pattern is a five-point structure, denoted as XABCD. As such, there are a total of four individual legs that make up the pattern. The first leg is the XA leg, the second leg is the AB leg, the third leg is the BC leg, and the final leg is the CD leg. Can you see how the A point and the C point within the bullish cypher structure are making higher highs, and similarly, how the B point is making a higher low?
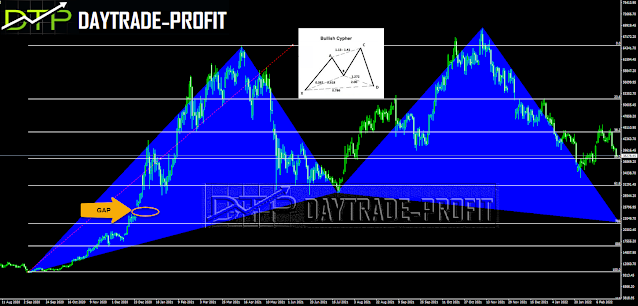
Bullish Cypher
The AB leg must retrace the XA leg by at least 38.2%, and it should not exceed 61.8%.
The C point within the structure should be a minimum 113% projection of the XA leg, measured from point B. At the same time, the C point should not extend beyond the 141.4% level.
Point D should terminate at or near the 78.6% Fibonacci retracement level of the price move as measured from the start at point X to point C.

This review does not include any document and/or file attached to it as an advice or recommendation to buy/sell securities and/or other advice