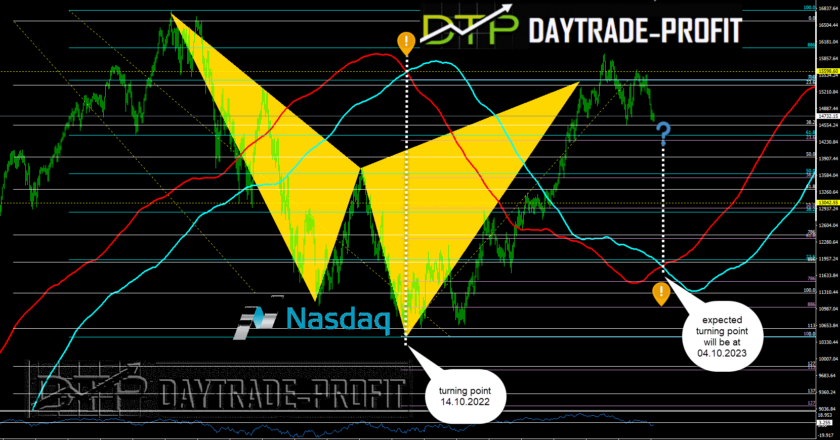
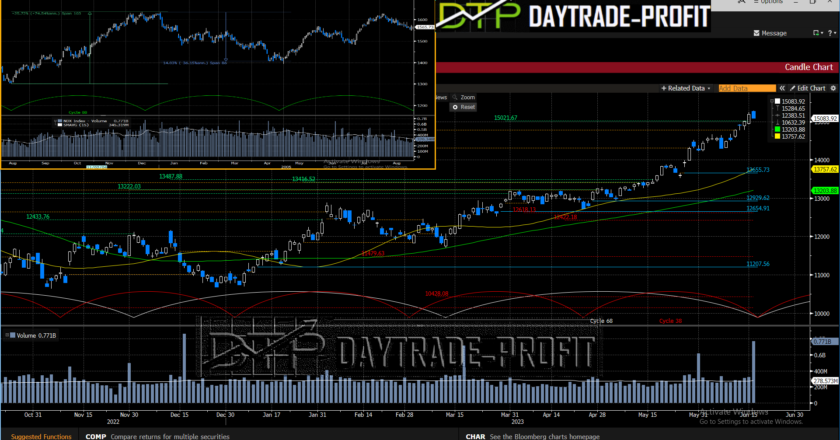
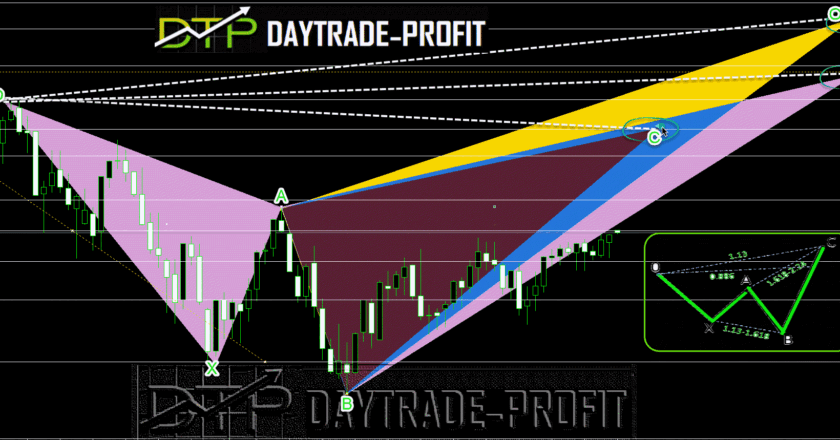
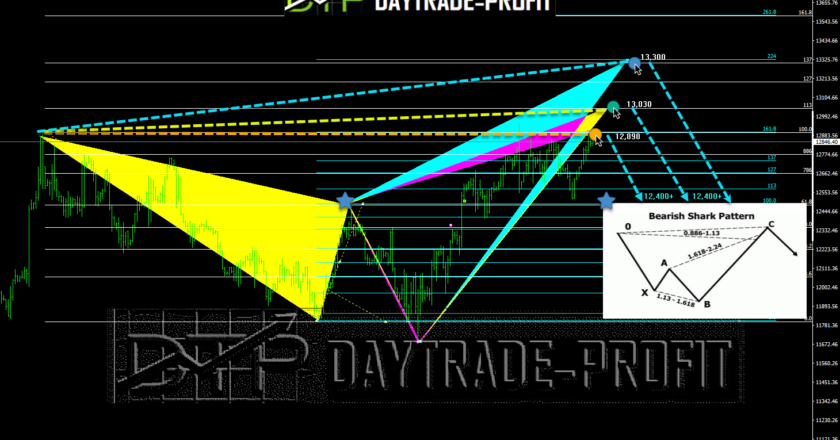
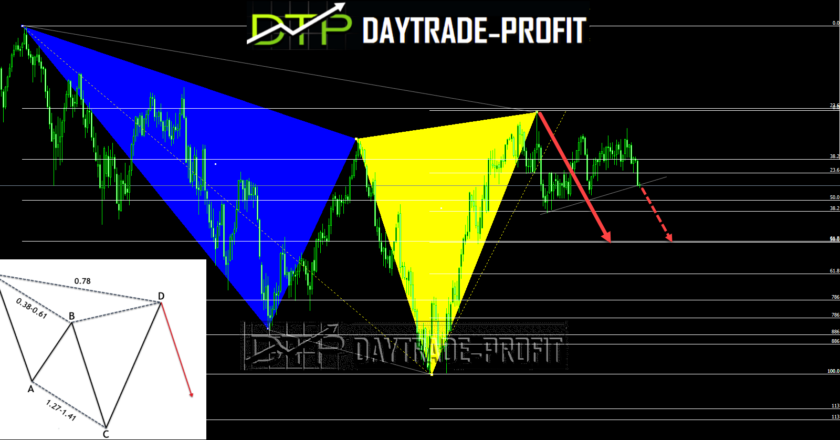
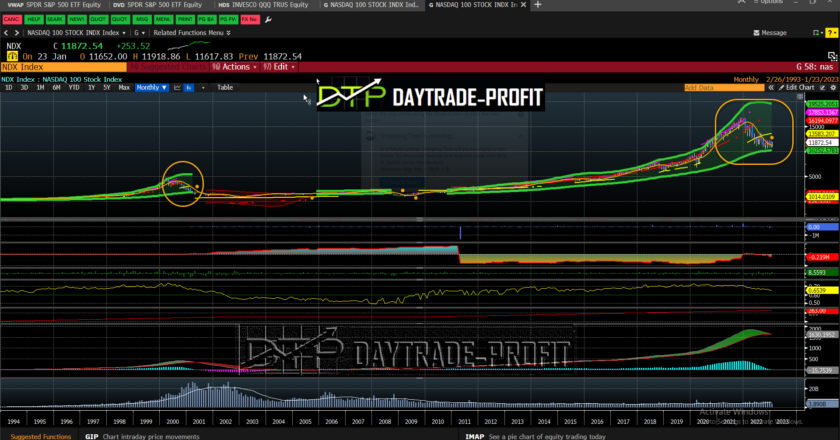
Yearly Archives: 2023

stock market forecast

It’s not where it’s when the correction will come

Are we seeing the high for the short-medium period?  Identifying signs of a potential market top can be challenging, as market conditions can vary and indicators may differ across different market cycles. However, here are some general signs that investors and analysts often consider when assessing whether a market may be reaching a top:  Overvaluation: Elevated market valuations, such as…

Read more

S&P 500 harmonic pattern

Do stock market expectations reflect the situation?

Does the economic situation of the stock market combined with the bond markets reflect the real problem? We have contradictions in many economic models that we now see in markets and economies, this is not a healthy situation sign – someone will have to reset and get back into balance Market Uncertainty: in some cases, high bond yields and rising…

Read more

EUR/USD analysis

Bullish Momentum Builds as EUR/USD Breaks Key Resistance Level

EUR/USD Technical analysis The technical outlook for EUR/USD depends on the timeframe being considered. In the short term, the pair may experience some volatility as traders respond to changes in market sentiment and economic data releases – we may see a very fast move towards 1.1180 1.1230 resistance and even to 1.1340 -1.1370 when the pair break above 1.1090 on…

Read more

Nasdaq analysis

Technical Review of the Current Market Trends on the NASDAQ

Markets Technical Analysis At the beginning of the year, I covered a post about the markets: “are markets going up to get amnesty, or its a trend change?” now we are fighting -Will the long-awaited breakthrough come or will we be in for another kind of surprise? Tricky mode situation Regarding support and resistance levels, the NASDAQ has established several key…

Read more

Dow Jones analysis

Does the Dow Jones, which was an initial indicator, now indicate continued weakness in the markets?

Markets Technical Analysis If we look carefully at the Dow Jones index then we can identify a harmonic pattern: Bearish Cypher pattern Before I explain the essence of the template, trading goals, etc. Keep those numbers in front of your eyes:A daily Break below 33100 points will confirm more downtrend correction to the 31800-32100+- point area while staying above it…

Read more